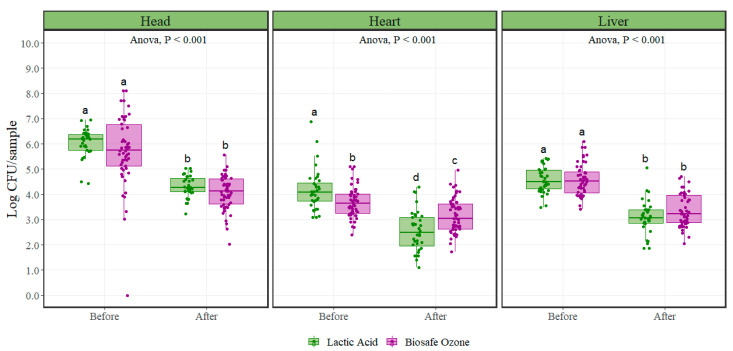
Figure 1.
Mesophilic aerobic plate counts (Log CFU/sample; equivalent to Log CFU/100 cm2) before and after lactic acid and ozone interventions on variety meats (n = 54 per treatment). In each boxplot, the horizontal line crossing the box represents the median, the bottom and top of the box are the lower and upper quartiles, the vertical top line represents 1.5 times the interquartile range, and the vertical bottom line represents 1.5 times the lower interquartile range. a–d For each individual variety meat, boxes with different letters are significantly different according to ANOVA analysis followed by a pairwise comparison T-test at p < 0.05. The points represent the actual data points.

