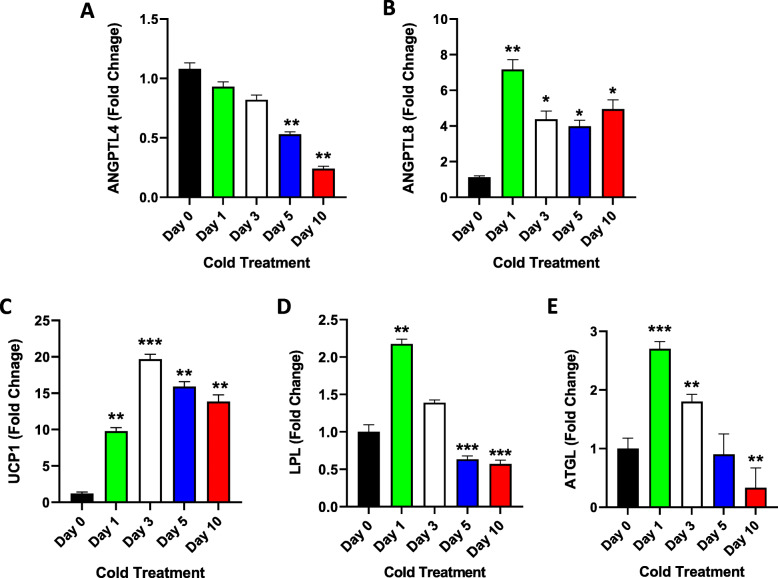
Fig. 3.
SAT UCP1, ANGPTL4 and ANGPTL8 gene expression measured at Day 0 (Control no cold exposure, n = 5), Days 1, 3, 5 and 10 post cold treatment at 4 0 C (n = 10 each). A: Gene expression level of ANGPTL4 in SAT as measured by RT-PCR at different time points of cold treatment. B: Gene expression level of ANGPTL8 in SAT as measured by RT-PCR at different time points of cold treatment. C: Gene expression level of UCP1 in SAT as measured by RT-PCR at different time points of cold treatment. D: Gene expression level of LPL in SAT as measured by RT-PCR at different time points of cold treatment. E: Gene expression level of ATGL in SAT as measured by RT-PCR at different time points of cold treatment. * indicates P-value ≤ 0.05; ** indicates P ≤ 0.001; *** indicates P ≤ 0.0001 as determined using Student’s t-test

