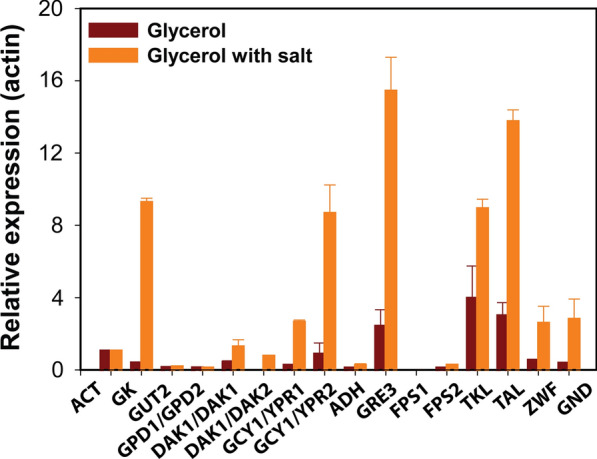
Fig. 4.

Expression profiles for genes during growth on glycerol (dark red color) and glycerol with salt (orange color) in nitrogen-rich medium. Genes are selected from the glycerol 3-P pathway, DHA pathway, glycerol uptake pathways, and PP pathway in Y. lipolytica PO1f. Gene expression levels were normalized based on the expression of the actin gene (ACT), glycerol kinase (GK), glycerol-3-P dehydrogenase (GUT2), glycerol-3-P dehydrogenase (GPD1/GPD2), dihydroxyacetone kinase (DAK1/DAK1), dihydroxyacetone kinase (DAK1/DAK2), glycerol dehydrogenase (GCY1/YPR1), glycerol dehydrogenase (GCY1/YPR2), arabitol dehydrogenase (ADH), aldose reductase (GRE3), aquaglyceroporin (FPS1/FPS2), transketolase (TKL1), transaldolase (TAL1), glucose-6-phosphate dehydrogenase (ZWF1), and 6-phosphogluconate dehydrogenase (GND1)
