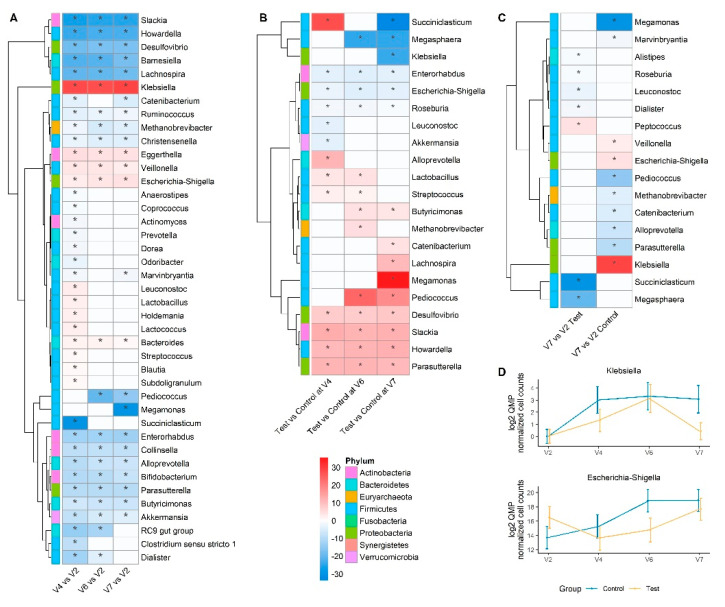
Figure 3.
Genus-level differential analysis based on Quantitative Microbiome Profiling (A) Heatmap of differentially abundant genera between each visit and baseline (V2) in the Control group. Red indicates higher fold-change and blue lower fold-change with regards to baseline (B) Heatmap of differentially abundant genera between Test and Control groups at each visit. Red indicates a higher fold-change and blue a lower fold-change in Test group (C) Heatmap of differentially abundant genera between follow-up (V7) and baseline (V2) which behave differently in the two groups. Red indicates higher fold-change and blue lower fold-change with regards to baseline (V2). For all heatmaps, only taxonomically assigned genera were selected based on QMP normalized counts >10.000.000, (FDR adj. * p < 0.1, DESeq2-based Wald test). Non-significant fold changes were set to zero for heatmap display and significant fold changes are highlighted by a star. (D) Quantitative log2 abundance of Escherichia/Shigella and Klebsiella in response to Hp treatment along the study, as mean ±95% CI.

