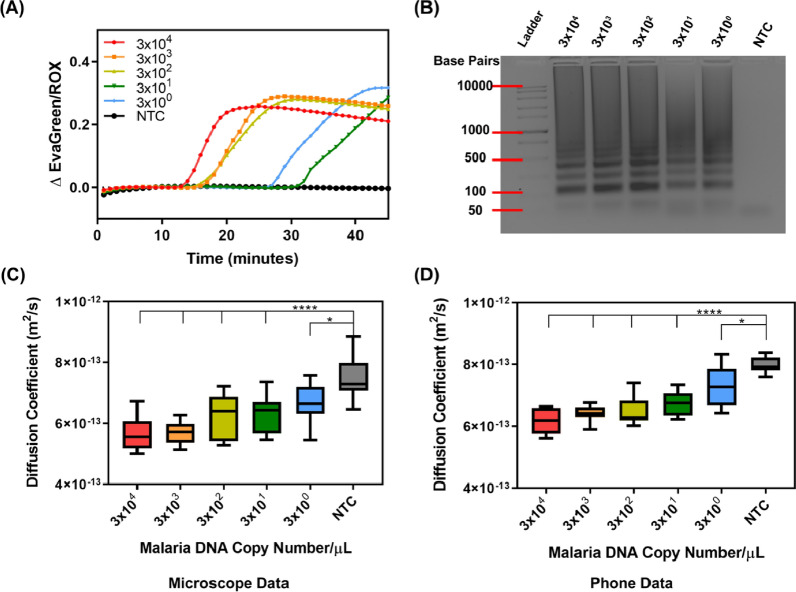
Fig. 2.
Plasmodium falciparum genomic DNA detection targeting 28 s rRNA. A Real-time fluorescence data during a 45-min LAMP reaction with concentrations ranging from 3 × 10⁴ to 3 × 100 DNA copies/µL. B The representative LAMP DNA banding pattern for all positive samples are confirmed in 2% agarose gel electrophoresis (note the NTC shows no banding pattern). C PD analysis from the microscope images of the samples indicates the change in diffusion coefficient for LAMP samples with a statistically significant difference from the negative template control (NTC) for samples with 3 × 10⁴–3 × 101 (****p < 0.0001) and 3 × 100 (*p < 0.05) DNA copies/µL. D PD analysis on smartphone device indicates statistically significant differences between 3 × 10⁴ and 3 × 101 (****p < 0.0001) and 3 × 100 (*p < 0.05) DNA copies/µL and the NTC. NTC here represents water added in p lace of genomic DNA (N = 4)

