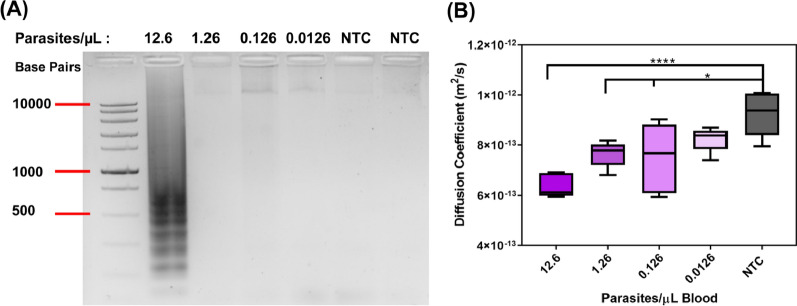
Fig. 5.
Serial dilutions of patient ID 2 for the determination of the LOD in patient samples using 18 s primers. A A representative gel from dilutions of ID 2 with concentrations ranging from 12.6 to 0.0126 parasites/μL. Only the 12.6 parasites/μL sample showed consistent amplification in gel represented by the dark smeared banding. B Diffusion coefficients from smartphone PD analysis of diluted samples yielded a LOD of 0.126 parasites/µL blood. All dilutions, 12.6 parasites/µL blood (****p < 0.0001), 1.26 and 0.126 parasites/µL blood (*p < 0.05), except 0.0126 parasites/µL blood were found to be statistically different from NTC. (N = 3)

