Figure 6.
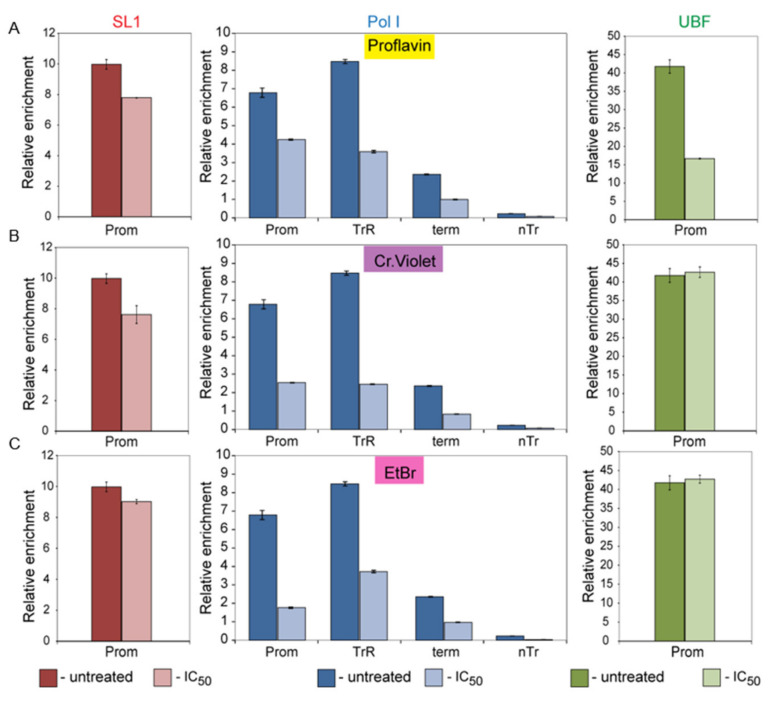
ChIP analysis of the rDNA repeat reveals that intercalating compounds alters Pol-I occupancy at rDNA. HCT116 p53−/− cells grown to 70% confluence and were either with proflavine (Pro) (A), or Crystal Violet (CV) (B) or Ethidium Bromide (EtB) (C) for 30 min prior to chromatin crosslinking. Concentration of all drugs were equal to the IC50 in vivo (Table 2). ChIP assays were performed using antibodies specific either to TAFI110 subunit of human SL1 complex (left panel), or to A194 subunit of human Pol-I complex (middle panel) or to human UBF (right panel). Purified, immunoprecipitated DNA was analyzed by qPCR using specific probes and primers derived from different regions of rDNA repeats as described earlier [18]. Internal standards were used for absolute quantification of immunoprecipitated DNA and chromatin input. The value of each bar represents the difference between the signals from the specific antibody and from the negative control (an appropriate IgG) expressed as % from total chromatin input. Signal representing the transcribed region (TrR) is the average of the combined signal from 5’ETS, 18S, 5.8S and 28S regions of rRNA. Signal representing the non-transcribed region (nTrR) is the average of the combined signal from IGS1 and IGS2 regions. The standard deviations from three independent experiments are shown; n = 3.

