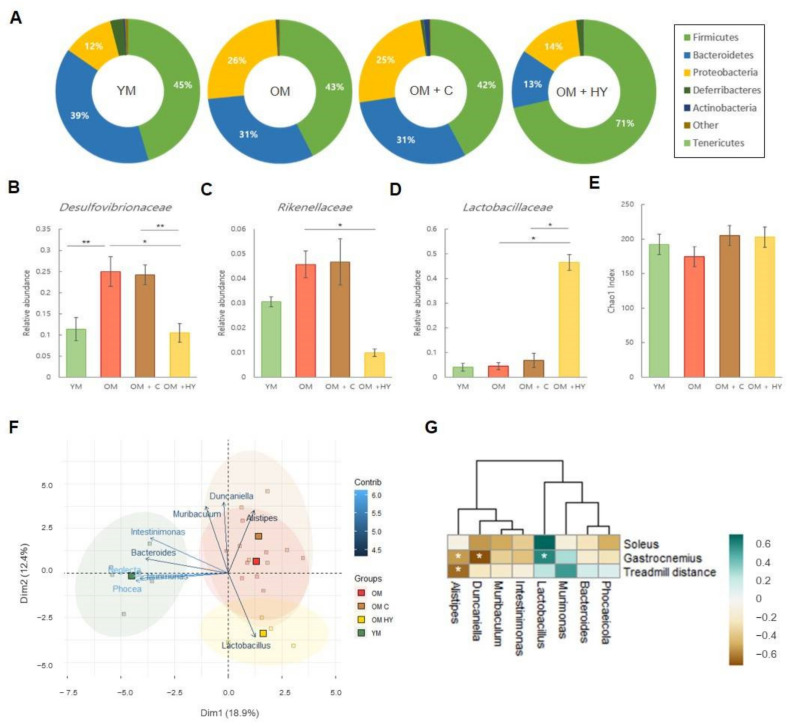
Figure 7.
The effect of HY7715 treatment on the abundance of bacterial taxa in mouse cecum. (A) The relative abundance of phyla in each treatment group. (B–D) Family-level taxa of the most abundant bacteria. (E) The α-diversity of each group (Chao1 index). (F) A plot of the principal component analysis (PCA) scores showing the variation of each treatment group and the contribution of bacteria at the genus level. Dimension 1 (Dim1) explains 18.9% of the variance and dimension 2 (Dim2) explains 12.4% of variance. (G) Spearman’s correlation analysis was performed between the bacterial genus-level taxa and the measured physiological factors (muscle mass and treadmill distance). YM, young mice; OM, old mice; OM + C, creatine-treated old mice; OM + HY, HY7715-treated old mice; contrib; contribution. N = 5, The Mann–Whitney U test was used for statistical analysis. Data are expressed as the mean ± SEM (* p < 0.05 and ** p < 0.01).

