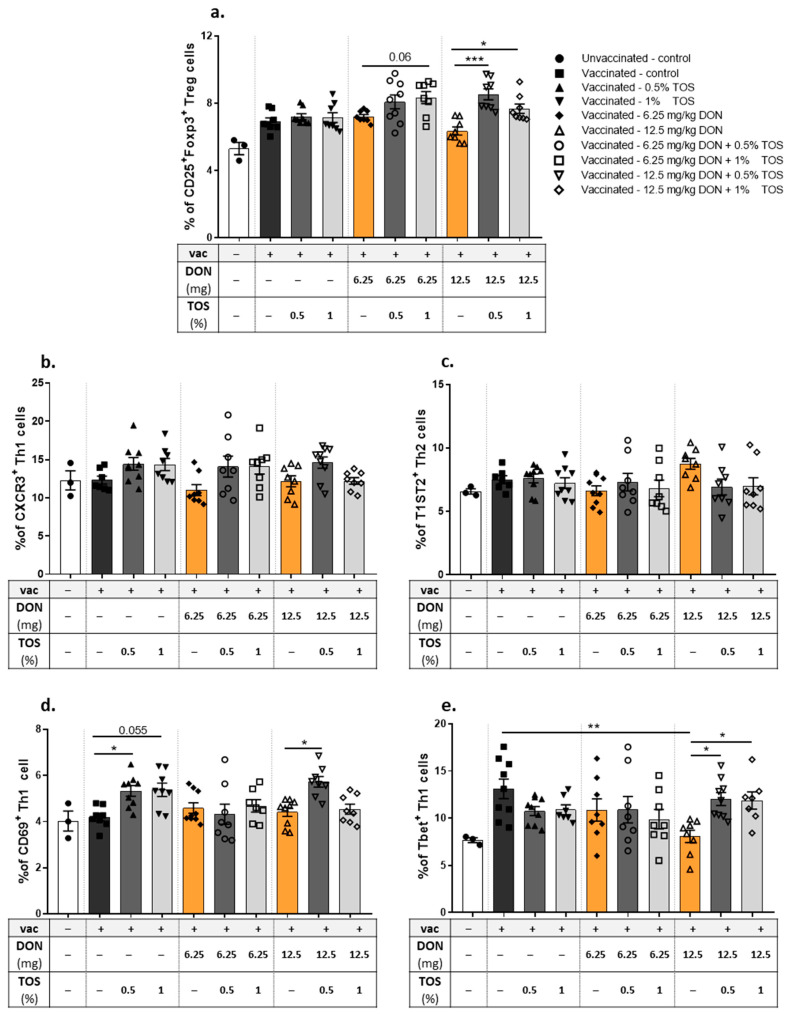
Figure 4.
Flow cytometric analysis of T cell subpopulations in the spleen of vaccinated (vac +) and unvaccinated (vac −) mice fed on diets containing deoxynivalenol (DON) and/or trans-galacto-oligosaccharides (TOS). Percentages of (a) CD25+Foxp3+ regulatory T cell (Treg), (b) CXCR3+ Th1 cells, (c) T1ST2+ Th2, (d) CD69+ CXCR3+ Th1 cells and (e) Tbet+ CXCR3+ Th1 cells. Data are presented as mean ± SEM. * p < 0.05, ** p < 0.01 and *** p < 0.001 indicate statistical differences.

