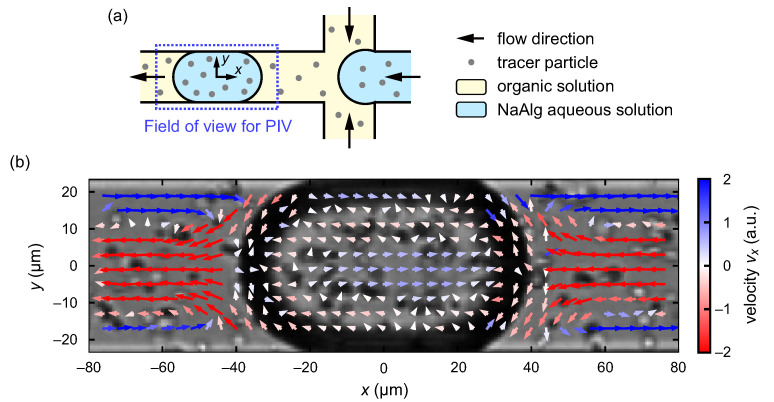
Figure 7.
(a) Schematic illustration of the field of view for the PIV analysis, depicted by the blue dashed rectangle (not to scale). The droplet frame is adopted and the instantaneous center of mass of a flowing droplet is set as the origin. (b) Velocity field in the droplet frame inside and around the droplet flowing just after the junction. Color code corresponds to the velocity component in the x direction.

