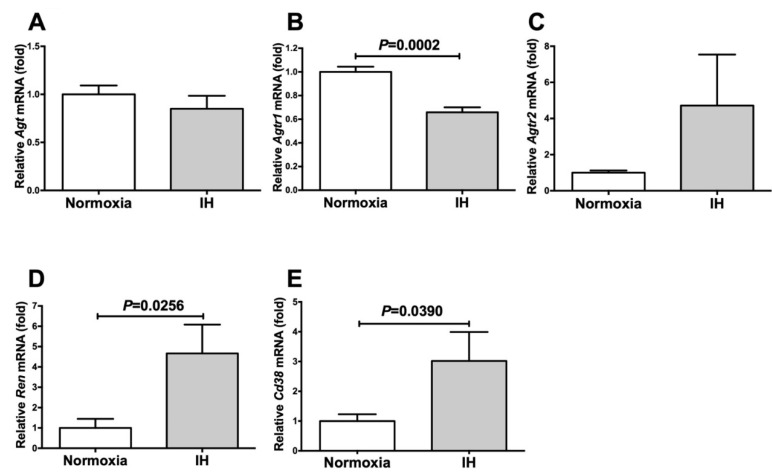
Figure 2.
The mRNA levels of Agt (A), Agtr1 (B), Agtr2 (C), Ren (D), and Cd38 (E) in the As4.1 JG cells subjected to normoxia or IH for 24 h. The levels of the mRNAs were measured by means of a real-time RT-PCR using rat insulinoma gene (Rig)/ribosomal protein S15 (Rps15) as an endogenous control. The data are expressed as the mean ± SE for each group of six independent experiments (n = 6). The statistical analyses were performed using a Student’s t-test.

