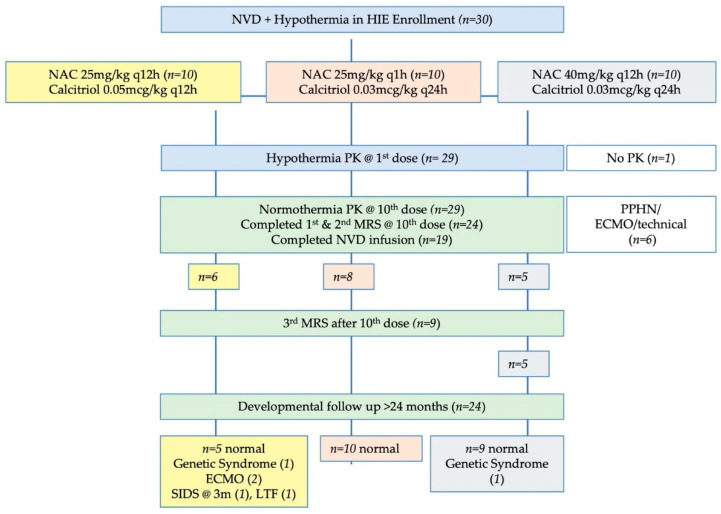
Figure 1.
Study flow diagram. Note that the number of infants with developmental follow-up flows from the original number of infants in each dosing group, not just the infants with complete NVD infusions or complete MRS data. The number of infants with useable data for each MRS metabolite may vary slightly from these numbers due to MRS quality controls for spectral fit which are unique to each metabolite.

