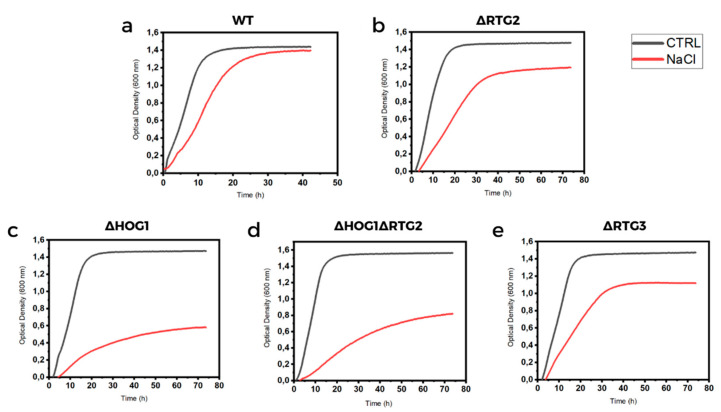
Figure 3.
Micro-culture growth curves of wild-type and mutant cells. (a) Wild-type (WT) and (b–e) indicated mutant cells (∆RTG2, ∆HOG1, ∆HOG1∆RTG2 and ∆RTG3) grown overnight in YPD medium were diluted to 0.01 OD600 in fresh liquid YPD with or without 0.8 M sodium chloride (NaCl), and optical density was measured at 600 nm (OD600) over time with a high-precision TECAN microplate reader. Each experiment was performed in triplicate, and representative micro-culture growth curves from three independent experiments are reported.

