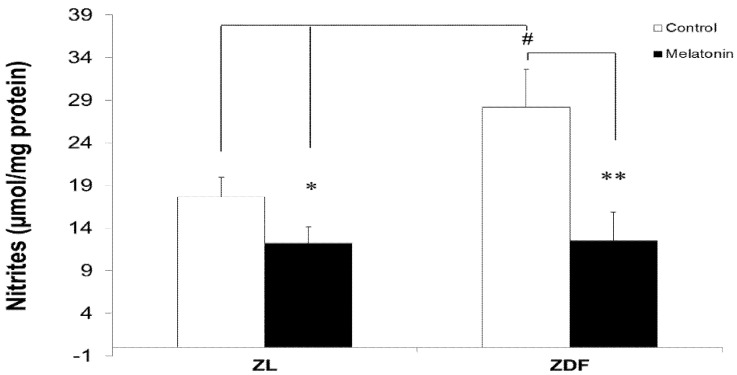
Figure 5.
The effect of melatonin on nitrite levels in mitochondria isolated from BAT fat depots of control (untreated) and melatonin-treated ZDF and ZL rats. Values are shown as mean ± SD. Superscript letters express significant difference measured using two-way ANOVA followed by the Tukey post hoc test. * p < 0.05 (M-ZL compared with C-ZL rats), ** p < 0.01 (M-ZDF compared with C-ZDF rats), and # p < 0.05 (C-ZDF and M-ZDF compared with C-ZL rats).

