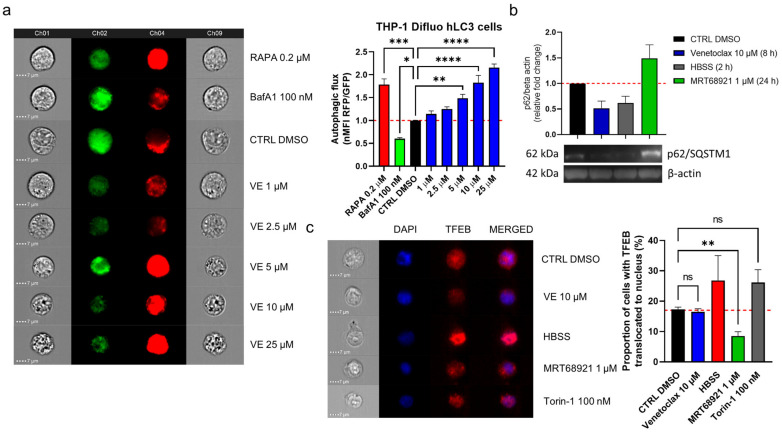
Figure 6.
Venetoclax induces autophagy in CLL cells. (a) THP1-Difluo hLC3 cells (5 × 10⁵ cells/mL) following the treatments with venetoclax (VE; 1–25 µM), the autophagy inducer rapamycin (RAPA; 200 nM), and the autophagy inhibitor bafilomycin A1 (BafA1; 100 nM) for 24 h. The expression of GFP and RFP were determined by imaging flow cytometry. Data are means ± SEM of 5 independent experiments. Representative cell images for each sample are shown; (b) Immunoblot analysis of p62/SQSTM1 in MEC-1 cells (1 × 10⁶ cells/mL) treated with vehicle control (0.2% DMSO) and 1 µM MRT68921 for 24 h, 10 µM venetoclax for 8 h, or HBSS for 2 h. The cells were harvested and lysed, and the proteins were separated by SDS PAGE, blotted onto nitrocellulose membranes, and probed for the expression of the autophagy marker p62/SQSTM1, with the loading control of β-actin. Data are means ± SEM of 3 independent experiments. A representative immunoblot is also shown; (c) Representative cell images (left) and quantification (right) of TFEB translocation in MEC-1 cells. The cells (5 × 10⁵ cells/mL) were treated with the vehicle control (0.2% DMSO) or to 10 µM venetoclax, HBSS, 1 µM MRT68921 or 100 nM Torin-1, for 1 h. After, the cells were fixed and permeabilized, and stained with an anti-TFEB antibody and the nuclear stain DAPI. Nuclear translocation of TFEB was monitored using imaging flow cytometry. Data are means ± SEM of ≥3 independent experiments. One-way ANOVA with Dunnett’s multiple comparisons test was used. Not significant (ns), ∗, ∗∗, ∗∗∗, and ∗∗∗∗ denote p > 0.05, p < 0.05, p < 0.01, p < 0.001, and p < 0.0001 respectively.

