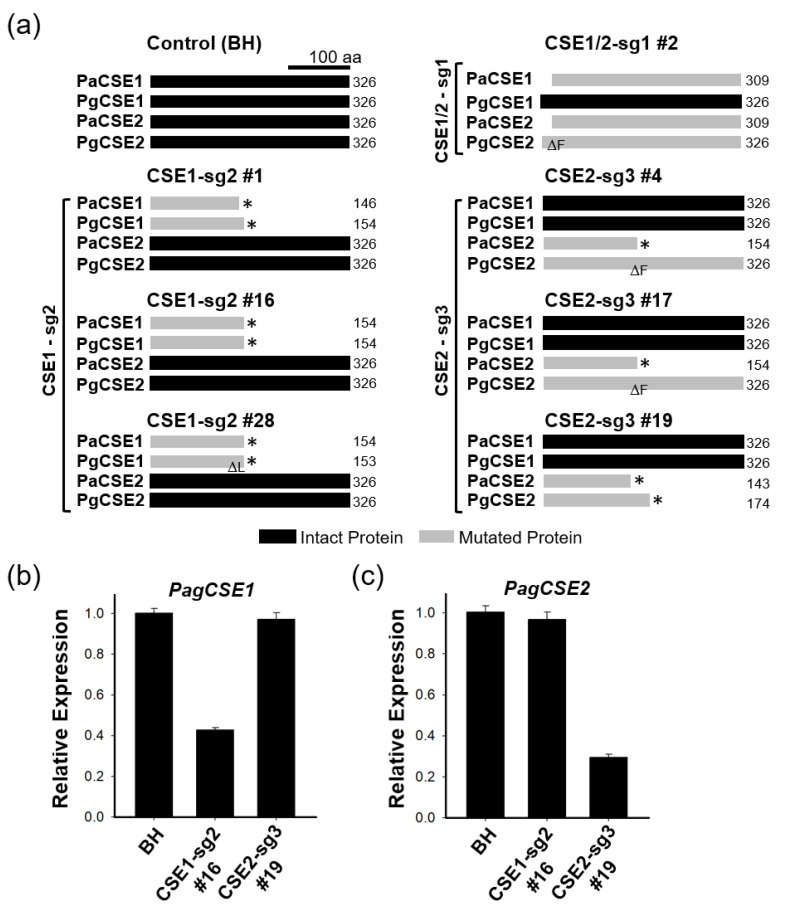
Figure 2.
Predicted CSE protein and CSE gene expression in transgenic CSE-CRISPR hybrid poplars. (a) Summary of mutations in each transgenic CSE-CRISPR poplar line. Expected normal CSE proteins in the control (BH) are shown as black bars with corresponding sizes. CSE proteins mutated by CRISPR editing are shown as gray bars with corresponding sizes. Asterisks indicate non-sense mutations, and means a deletion of an amino acid. (b,c) Expression of CSE gene in CSE-CRISPR poplars. Quantitative real-time PCR (RT-qPCR) was performed using primers targeting the c-terminal regions shown in (Figure 1a) (n = 6, error bar = S.E.). PagCSE1 indicates both PaCSE1 and PgCSE1.

