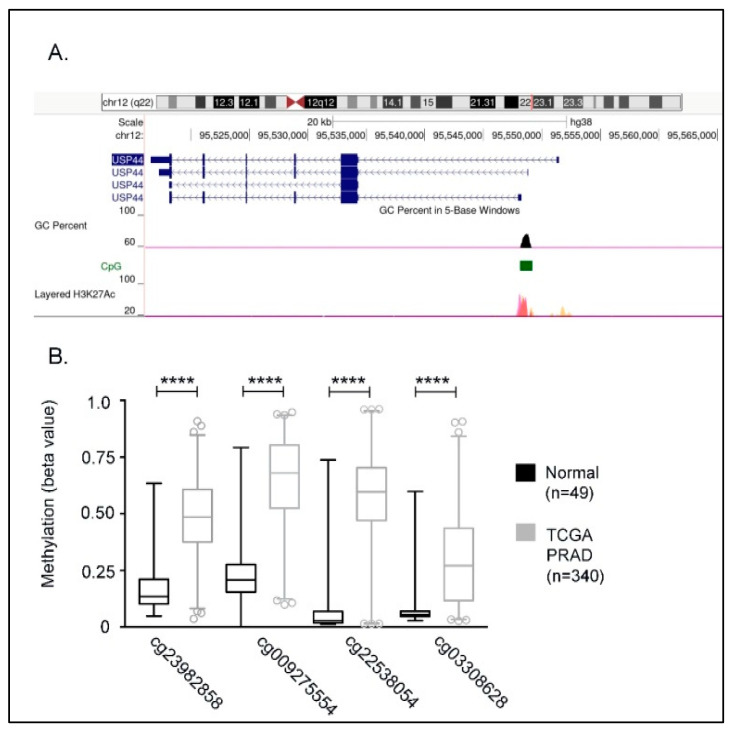
Figure 1.
USP44 promoter methylation. (A) Structure of USP44 gene isoforms by ENCODE genome viewer. Promoter regions with high CpG context (black peaks) is indicated with green color. Transcriptional start site is indicated by peaks of H3K27Ac histone marks according to ENCODE data. (B) Cytosine sites within the indicated CpG island that display significant methylation in prostate adenocarcinoma samples as compared to normal samples. Methylation data were obtained from TCGA Wanderer database and Mann-Whitney test was used to analyze methylation levels between cancerous and normal samples. p values < 0.0001 are indicated with four asterisks (**** indicates p < 0.0001).

