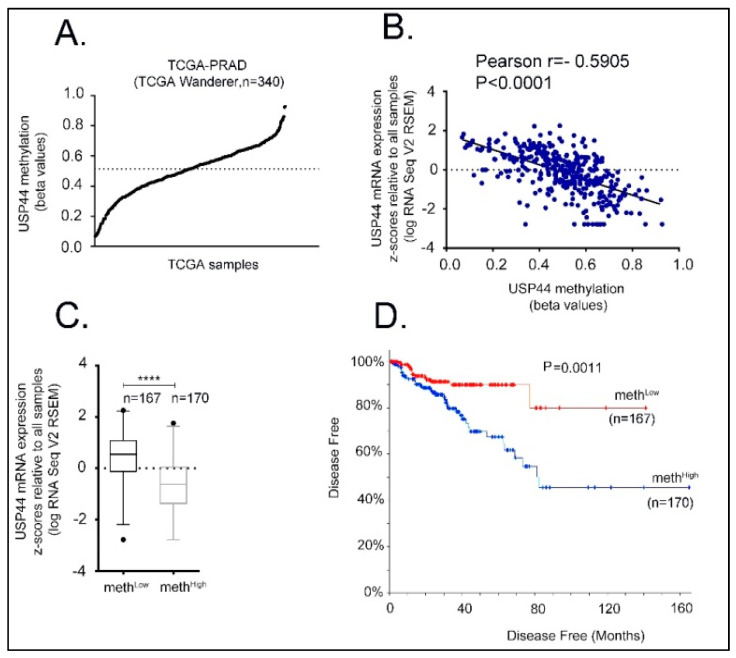
Figure 2.
USP44 promoter methylation and its correlation to prostate adenocarcinoma patient data. (A) USP44 promoter methylation calculated by the average methylation values of cg23982858, cg009275554, cg22538054, and cg03308628 sites in TCGA prostate adenocarcinoma samples (TCGA-PRAD). Data were obtained from TCGA Wanderer database. Median USP44 promoter methylation among TCGA samples is indicated by the horizontal line. (B) Correlation between USP44 promoter methylation and mRNA expression. Expression data were obtained by TCGA-PRAD Firehose Legacy. (C) Boxplot of USP44 mRNA levels in methHigh and methLow groups. p < 0.0001. (D) Disease-free curve comparing methHigh and methLow groups. Patient data were obtained by TCGA-PRAD Firehose Legacy through cbioportal. Log-rank test p = 0.0011 (**** indicates p < 0.0001).

