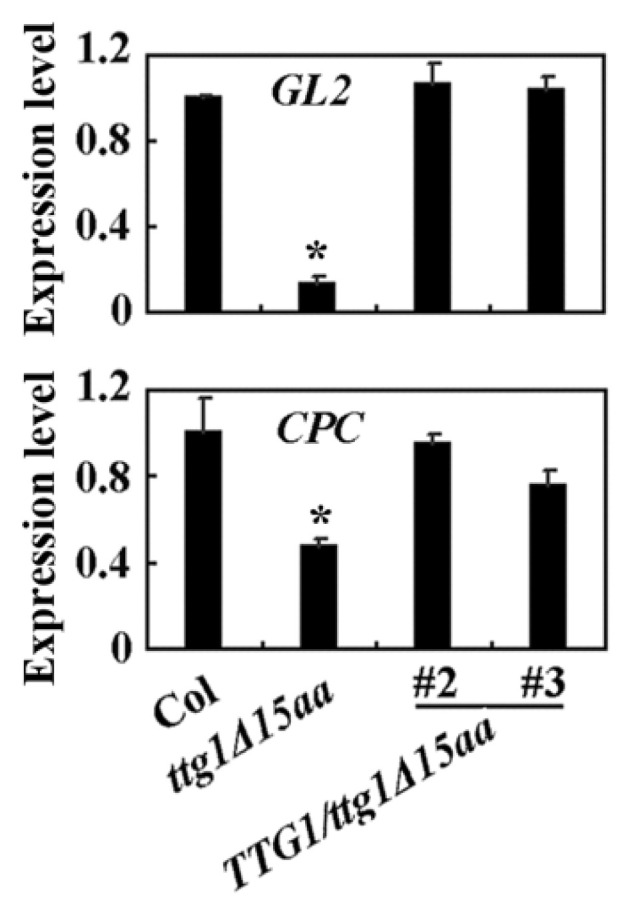
Figure 7.

Expression of GL2 and CPC in the Col wild type, the ttg1Δ15aa mutant, and the TTG1/ttg1Δ15aa transgenic plants. RNA was isolated from 10-day-old seedlings and qRT-PCR was used to examine the expression of GL2 and CPC. The expression of ACT2 was used as an inner control. The expression level of GL2 or CPC in the Col wild type was set as 1. Data represent the mean ± SD of three replicates. *, Significantly different from that in the Col wild type (Student’s t test, p < 0.01).
