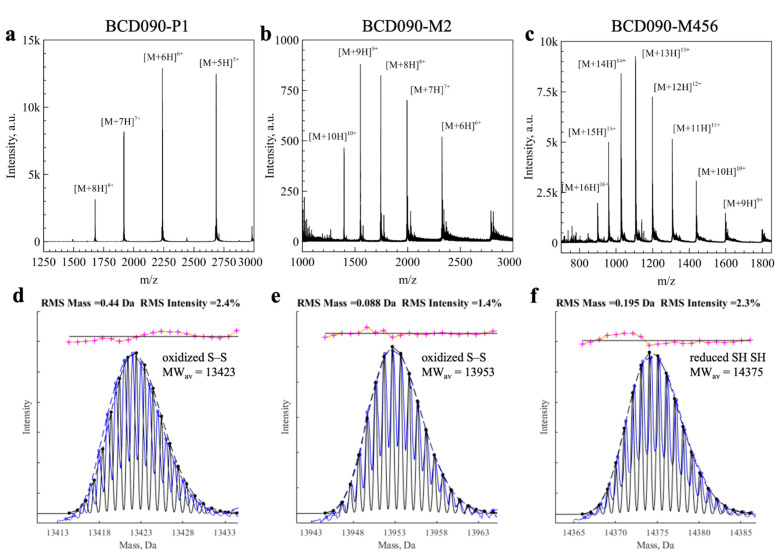
Figure 3.
Analysis of the single-domain antibodies by ESI-MS. (a–c) Experimental mass spectra with individual charge states indicated; (d–f) experimental isotopic distribution after charge deconvolution (blue) fitted with theoretical isotopic distribution (black). For BCD090-P1 and BCD090-M2, best fit obtained with the formula corresponding to oxidized cysteines (-2H) as expected. On the contrary, experimental data for BCD090-M456 were best fitted with formula with free cysteines.

