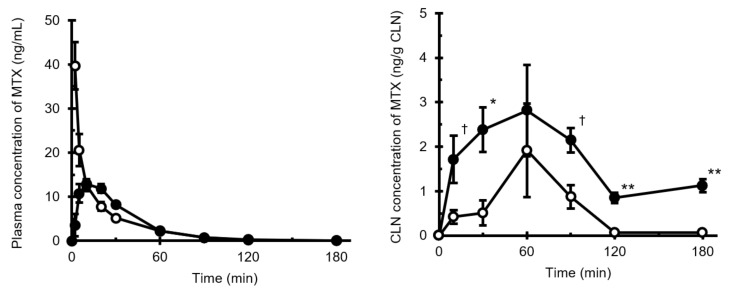
Figure 3.
Plasma (left) and CLN (right) MTX concentration–time profiles following intranasal and intravenous administration. Key: ○, i.v. administration; ●, i.n. administration. Data points have been expressed as mean ± standard error for four (i.v.) and six (i.n.) experiments at each time point in the plasma concentration–time profile and for four (i.v.) and six (i.n.) experiments at each time point in the CLN concentration–time profile. † p < 0.10, * p < 0.05, ** p < 0.01. Abbreviations: CLN, cervical lymph node; MTX, methotrexate.

