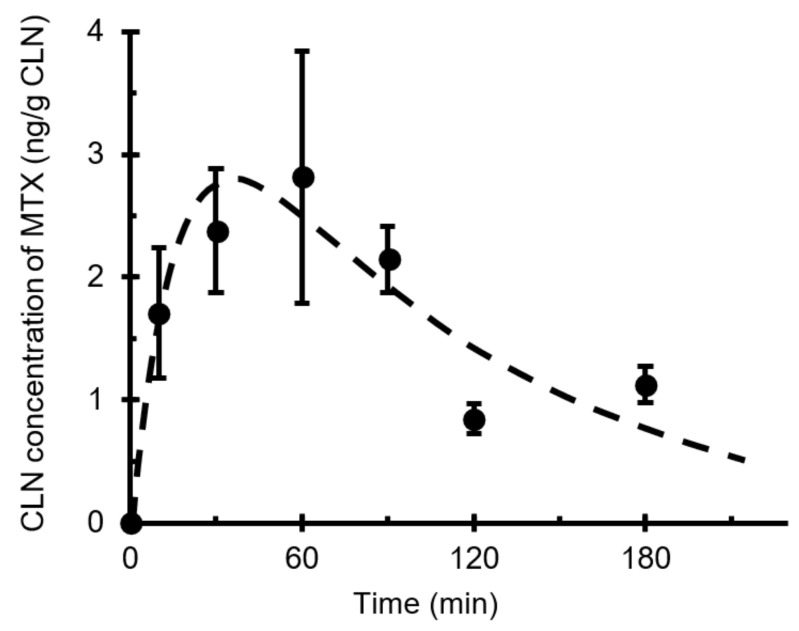
Figure 4.
Pharmaceutical model CLN concentration–time curve of intranasally administered MTX fit to experimental data. Key: ●, concentration in the CLN; - - - -, fitted profile. Curve fitting was performed via nonlinear regression using WinNonlin version 6.3. Data points are expressed as mean ± standard error values of at least four experiments. Abbreviations: CLN, cervical lymph node; MTX, methotrexate.

