Figure 3.
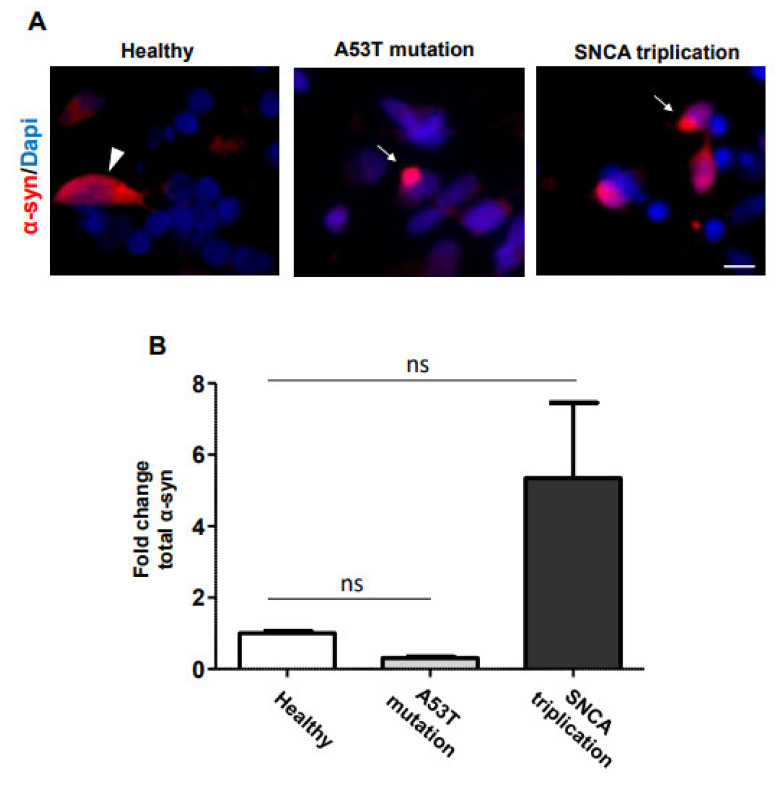
α-syn accumulation in mDA neuronal cultures from fPD patients. (A) Seventy-day-old mDA neuronal cultures, from healthy and familial PD lines, were stained with an anti-α-syn antibody. α-syn accumulation around the nucleus in the A53T mutation and SNCA triplication line is indicated by arrows, whereas the homogenous distribution of native α-syn immunostaining in the healthy line is indicated by the arrowhead. (B) The level of α-syn immunostaining was quantified using image analysis. Images are representative of at least three independent differentiations. All data in (B) are presented as mean ± SEM of three images acquired from three different coverslips. Data were analyzed by one-way ANOVA followed by Tukey’s multiple comparison post hoc test. * p < 0.05. The scale bar is 10 µm.

