Figure 5.
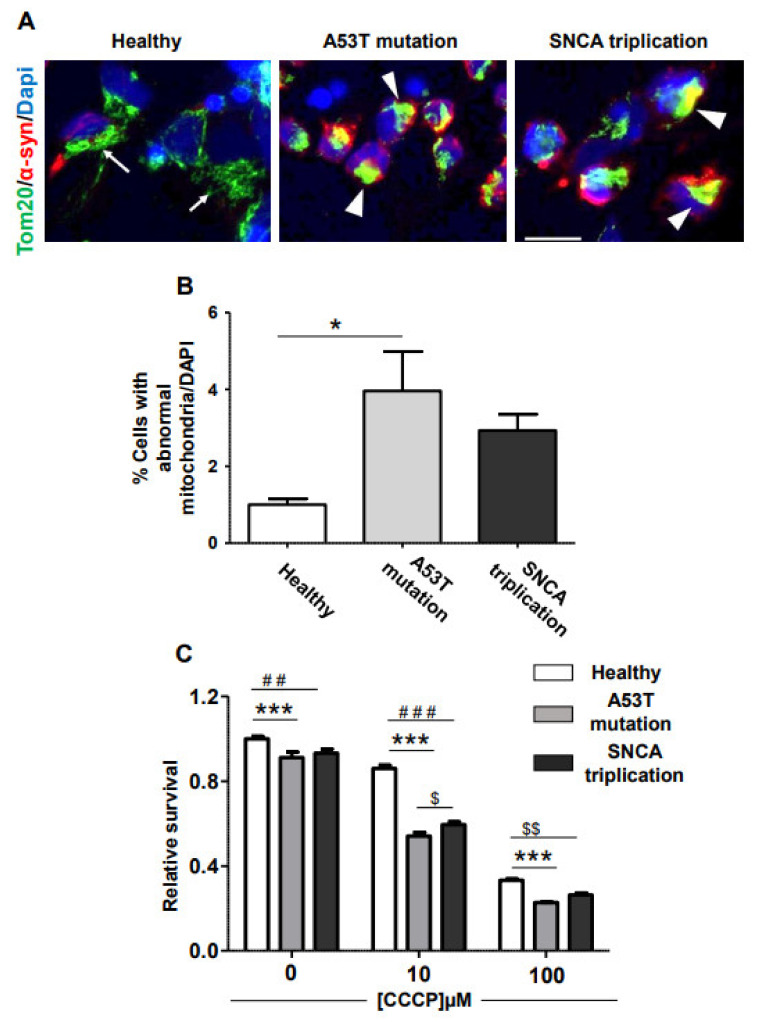
fPD-derived mDA neuronal cultures are more vulnerable to mitochondrial damage. (A) In order to assess abnormalities in mitochondrial morphology and its association with α-syn accumulation, we immunostained mDA neuronal cultures derived from healthy and fPD lines with an antibody against TOM20 and α-syn. mDA neuronal culture from a healthy subject presents a tubular mitochondrial network (arrow). In contrast, TOM20 staining in mDA neuronal cultures from fPD patients with A53T mutation and SNCA triplication appeared clumped (arrowhead), particularly in the cells with α-syn accumulations. (B) Abnormal mitochondrial morphology was quantified using image analysis. (C) mDA neuronal cultures from healthy and fPD lines were treated with different concentrations of CCCP, and cell viability was assessed using the MTT assay. All data in (B) are presented as mean ± SEM of three images acquired from three different coverslips. Data in figure (B) were analyzed by one-way ANOVA followed by Tukey’s multiple comparison post hoc test. * p < 0.05. All data in (C) are presented as mean ± SEM of four wells. Data in figure (C)were analyzed by two-way ANOVA followed by Bonferroni post hoc test. ## (Healthy line vs. SNCA triplication line at 0 µM CCCP) p < 0.01; ### (Healthy line vs. SNCA triplication line at 10 µM CCCP) p < 0.001; $$ (Healthy line vs. SNCA triplication line at 100 µM CCCP) p < 0.01; *** (Healthy line vs. A53T mutation line) p < 0.001; $ (A53T mutation line vs. SNCA triplication line at 10 µM CCCP) p < 0.05.The scale bar is 10 µm.

