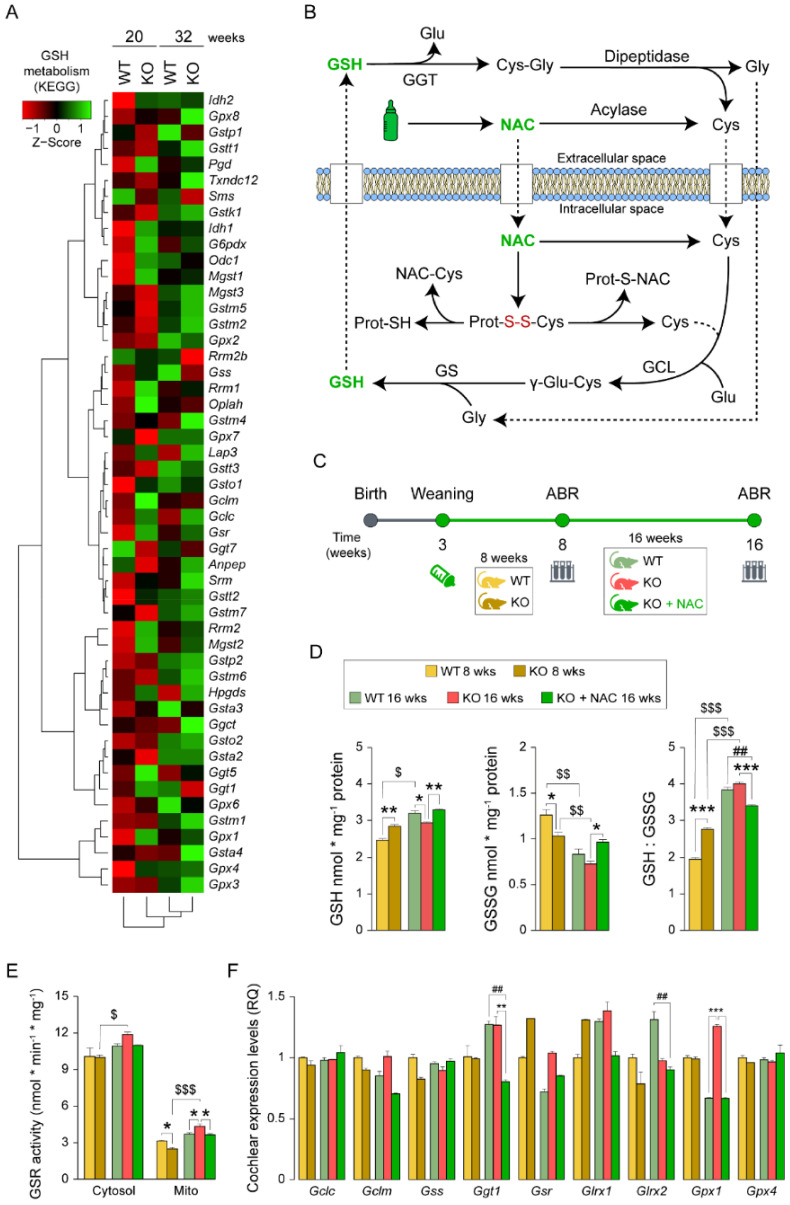
Figure 2.
Impact of N-acetylcysteine administration for glutathione metabolism. (A) Glutathione (GSH) metabolism (KEGG database) heatmap generated from differential expression data derived from RNAseq. (B) Scheme illustrating GSH biosynthesis, extracellular recycling and N-acetylcysteine (NAC) antioxidant power. GSH and NAC appear in green; glutathione synthesis and recycling enzymes appear in black capital letters: GCL (glutamate-cysteine ligase), GS (glutathione synthetase), GGT (gamma glutamyl transferase); glutathione precursors: Cys (cysteine), Glu (glutamate) and Gly (glycine); oxidized protein disulfide bonds in red (S-S). (C) Experimental design illustrating the start and end-time points of NAC administration (weaning-16 weeks), hearing evaluation (auditory brainstem response [ABR]) testing time points (8 and 16 weeks), experimental groups and sampling time points. (D) GSH, glutathione disulfide (GSSG) levels and GSH:GSSG ratio from pooled samples of 2 inner ears of 8- and 16-week-old wild-type (WT), Dusp1 knock-out (KO) and NAC-treated Dusp1 KO mice. All measurements were performed in triplicate. GSH and GSSG values are presented relative to milligram of protein. (E) GSR (glutathione reductase) activity in cytosolic and mitochondrial fractions from pooled samples of 2 inner ears per condition. Measurements were performed in triplicate, and values are presented relative to milligram of protein. (F) RT-qPCR gene expression levels of GSH-related enzymes from whole cochlea pooled samples from 3 mice per condition. Expression levels were calculated as 2−ΔΔCt (RQ) from triplicate measurements using Hprt1 as a reference gene and normalized to levels in 8-week-old WT mice. All data are presented as mean ± SEM. Statistical significance between genotypes and time points was analyzed by one-way ANOVA: * vs. KO, # vs. WT, $ 8-week-old mice vs. 16-week-old mice (*, $ p < 0.05; **, ##, $$ p < 0.01; ***, $$$ p < 0.001).

