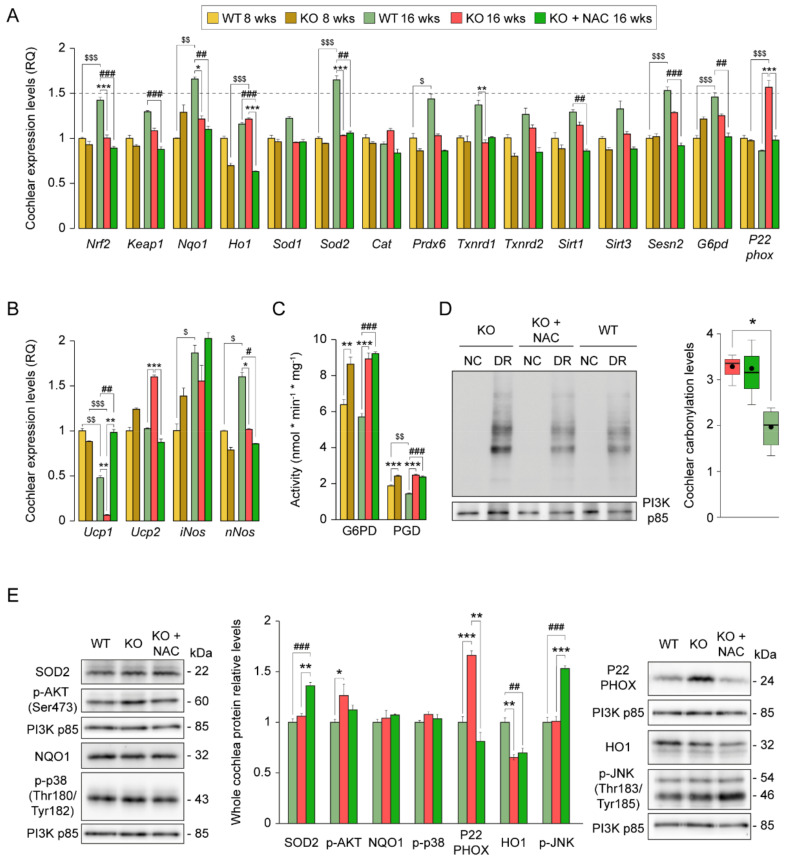
Figure 4.
Impact of N-acetylcysteine administration for cochlear redox homeostasis. (A,B) RT-qPCR gene expression levels of redox enzymes from whole cochlea pooled samples from 3 mice per condition. Expression levels were calculated as 2−ΔΔCt (RQ) from triplicate measurements using Hprt1 as a reference gene and normalized to levels in 8-week-old wild-type (WT) mice. Data are presented as mean ± SEM. (C) Glucose-6-phosphate dehydrogenase (G6PD) and 6-phosphogluconate dehydrogenase (PGD) activity from pooled inner ear cytosolic fractions of two mice per condition. Measurements were performed in triplicate, and values are presented relative to milligram of protein. Data are presented as mean ± SEM. (D) Cochlear oxidative protein carbonylation levels of pooled cochlear protein extracts from 3 mice per condition analyzed with the Oxyblot™ Kit. Derivatized protein extracts (DR) are shown together with non-derivatized extracts (NC) in the representative blot image. Quantification was performed in triplicate, and levels were referred to those of PI3K. Data are presented as a box plot, mean value is plotted as a filled circle and whiskers represent min and max values. (E) Western blotting of pooled cochlear protein extracts from 3 mice per condition. All protein levels are referred to those of PI3K and normalized to data from 16-week-old WT mice. Data are presented as mean ± SEM. Statistical significance between genotypes and time points was analyzed by one-way ANOVA: * vs. KO, # vs. WT, $ 8-week-old mice vs. 16-week-old mice (*, #, $ p < 0.05; **, ##, $$ p < 0.01; ***, ###, $$$ p < 0.001).

