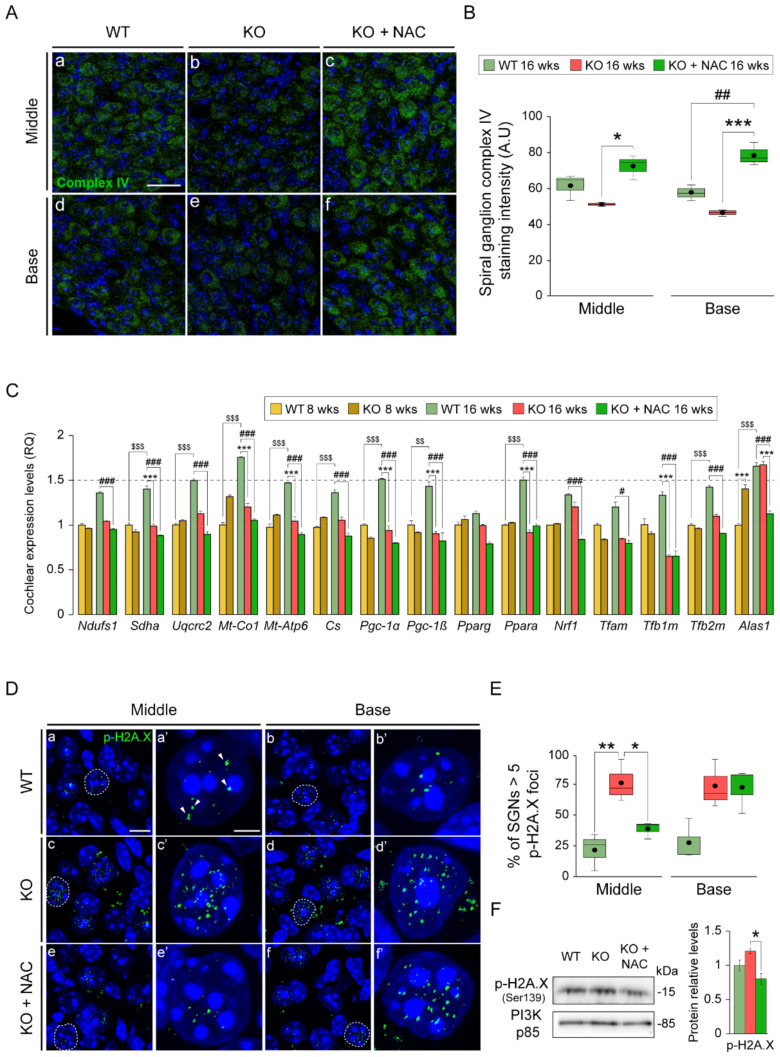
Figure 5.
N-acetylcysteine administration preserves mitochondria and reduces DNA damage foci in Dusp1−/− spiral ganglion neurons. (A) Representative basal and middle turn cochlear spiral ganglion (SG) cross-cryosections of 16-week-old wild-type (WT), Dusp1 knock-out (KO) and NAC-treated Dusp1 KO mice immunolabeled for mitochondrial complex IV (green). Scale bar: 20 μm in a. (B) Positive stained area intensity of the SG was quantified in 3 mice per condition in at least 3 serial sections per turn. Data are presented as a box plot, mean value is plotted as a filled circle and whiskers represent min and max values. (C) RT-qPCR gene expression levels of mitochondrial proteins and biogenesis program genes from whole cochlea pooled samples from 3 mice per condition. Expression levels were calculated as 2−ΔΔCt (RQ) from triplicate measurements using Hprt1 as a reference gene and normalized to levels in 8-week-old WT mice. Data are presented as mean ± SEM. (D) Representative basal and middle turn cochlear SG cross-cryosections of 16-week-old WT, Dusp1 KO and NAC-treated Dusp1 KO mice immunolabeled for p-H2A.X in green (a–f). Dashed lines: neuron in close ups (a’–f’). Arrowheads indicate positive foci. Scale bar: 10 μm in a and 2.5 μm in a’. (E) Percentage of SG neuron (SGN) nuclei with more than 5 p-H2A.X foci. p-H2A.X foci were counted in 5–10 neuronal nuclei per section in 4 serial sections per turn from at least 3 mice per condition. Data are presented as a box plot, mean value is plotted as a filled circle and whiskers represent min and max values. (F) Western blotting of pooled cochlear protein extracts from 3 mice per condition. p-H2A.X data are relative to those for PI3K and normalized to data from 16-week-old WT mice. Data are presented as mean ± SEM. Statistical significance between genotypes and time points was analyzed by one-way ANOVA: * vs. KO, # vs. WT, $ 8-week-old mice vs. 16-week-old mice (*, # p < 0.05; **, ##, $$ p < 0.01; ***, ###, $$$ p < 0.001).

