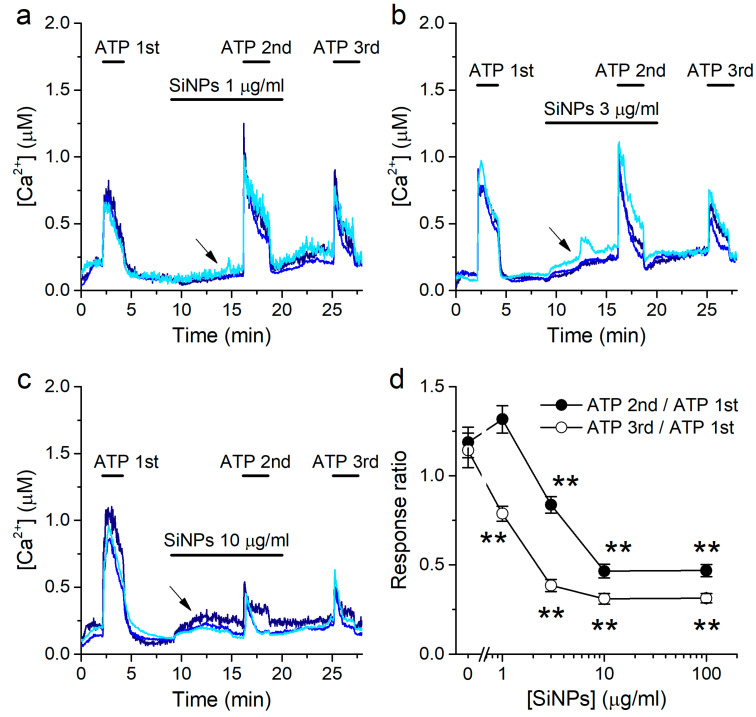
Figure 3.
SiNPs induce a concentration-dependent inhibition of the response to ATP. (a–c) Examples of intracellular [Ca2+] traces showing the effects of SiNPs when applied at 1 μg/mL (a), 3 μg/mL (b) or 10 μg/mL (c), before and during the 2nd application of 10 μM ATP. The arrows point to the increase in intracellular [Ca2+] induced by the application of the SiNPs. (d) Ratio between the amplitudes of the responses to the 2nd and 3rd applications of ATP and the amplitude of the response to the 1st application of ATP, as a function of the concentration of SiNPs. The data are represented as mean ± s.e.m. (n = 135, 135, 52 and 92 for SiNPs at 1, 3, 10 and 100 μg/mL, respectively. The asterisks (**) denote statistically significant difference with respect to the corresponding control data [SiNPs] = 0 μg/mL (p < 0.01; Kolmogorov-Smirnov test).

