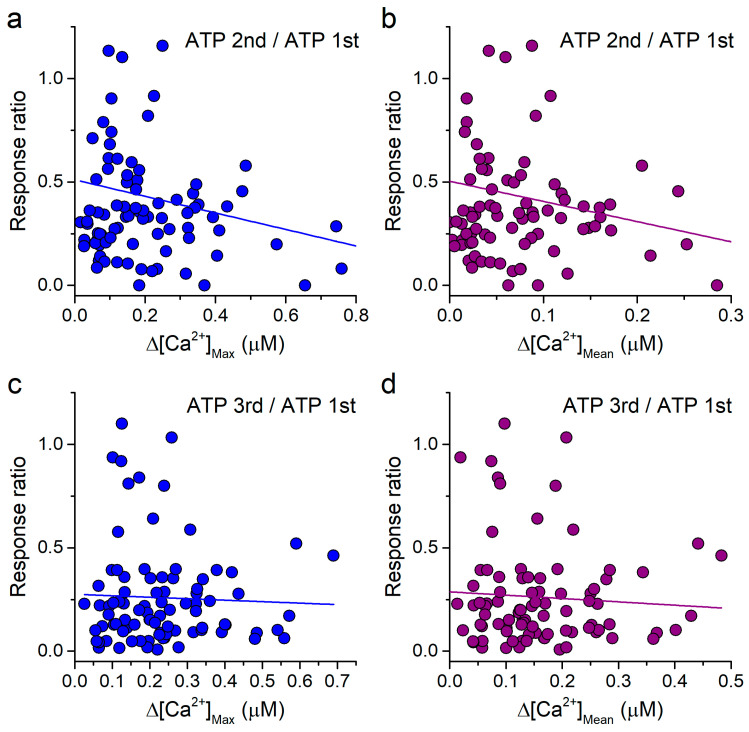
Figure 5.
Lack of correlation between the reduction in the response to ATP and the increase in intracellular [Ca2+] induced by SiNPs. (a,b) Plots of the ratio of the amplitudes of the responses to the 2nd and 1st applications of 10 μM ATP versus the maximal increase (a) and mean increase (b) in intracellular [Ca2+] induced by 100 μg/mL SiNPs. (c,d) Equivalent plots to those shown in panels (a,b), but using the ratio of the amplitudes of the responses to the 3rd and 1st applications of 10 μM ATP. The lines represent the corresponding linear fits, with R2 values of 0.04, 0.04, 0.002 and 0.004, for panels (a–d), respectively.

