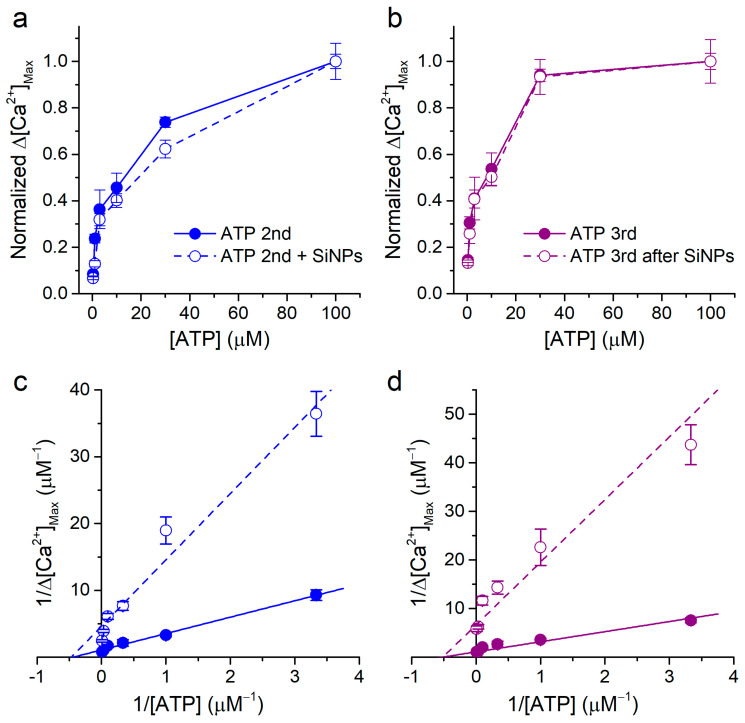
Figure 8.
Non-competitive inhibitory effect of SiNPs on the response to ATP. (a,b) Normalized concentration dependence of the amplitude of the responses to ATP, for the 2nd application (control and in the presence of SiNPs) and for the 3rd application (control and after washout of SiNPs). The normalization was performed by dividing the data sets of Figure 1d and Figure 5d by the corresponding values obtained for 100 μM ATP. (c,d) Lineweaver–Burk plots of the data shown in Figure 1d and Figure 5d. The lines represent fits with linear functions. The data are represented as mean ± s.e.m. The n numbers are the same as in the original figures.

