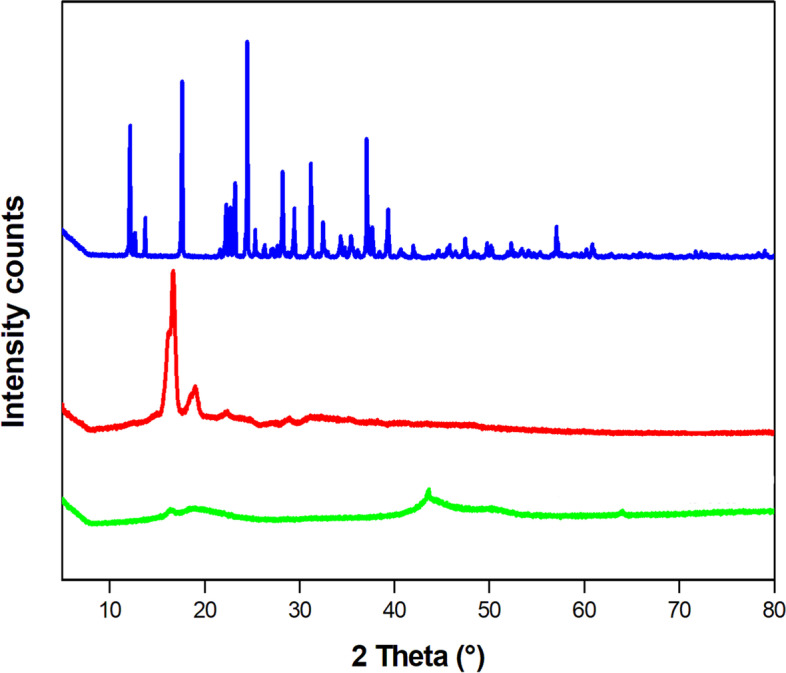
Fig. 3.

Differential scanning calorimetry (DSC) spectra of pure metformin, blank microparticles and metformin-loaded microparticles at a heating rate of 10 °C min−1. The melting peak of metformin is observed at approximately 232 °C (blue curve), and the melting peak of the blank PLA microparticles is observed at 178 °C (red curve). The absence of the characteristic metformin peak and the shift in the PLA peak in the spectrum of the metformin-loaded PLA microparticles (green curve) are significant for determining metformin dispersion inside the PLA microparticles
