Figure 7.

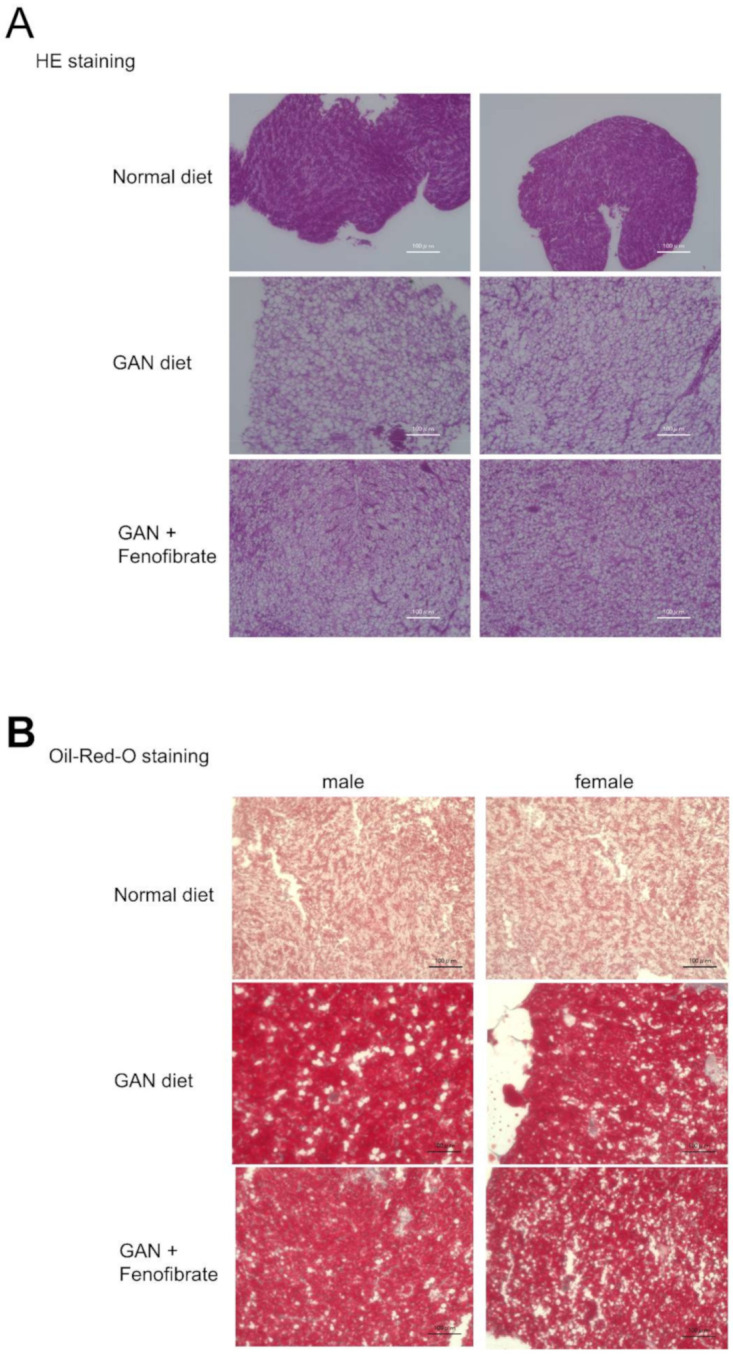
Liver evaluation using each type of staining after three months of fenofibrate administration. (A) Evaluation using hematoxylin and eosin (HE) staining, (B) Evaluation with Oil Red O staining. The scale bar represents 100 µm.

Liver evaluation using each type of staining after three months of fenofibrate administration. (A) Evaluation using hematoxylin and eosin (HE) staining, (B) Evaluation with Oil Red O staining. The scale bar represents 100 µm.