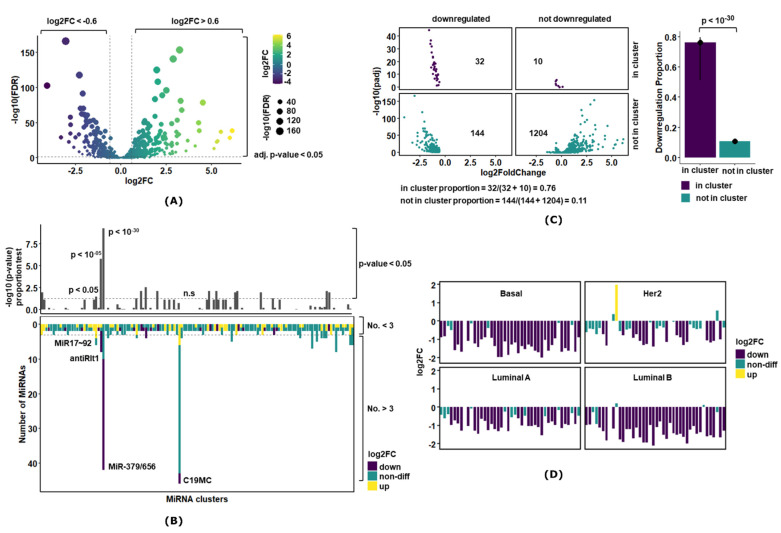
Figure 1.
Differential miRNA expression analysis in breast cancer. (A) The volcano plot showing miRNA with large fold changes (x-axis) along with statistical significance (y-axis) in breast cancer. The dotted horizontal line denotes p-value of 0.05, and the dotted vertical lines denote absolute log2FC > 0.6. The color represents the biological significance, and size represents statistical significance. The upregulated genes are toward right and downregulated genes are toward the left of the volcano plot. (B) The plot represents the 2 × 2 contingency table that compares the proportion of downregulation of miRNAs in the cluster with the standard defined by its complement, i.e., downregulation of miRNAs not in the cluster. The bar-plot represents the downregulation proportions, and the vertical line on the bar represents the 95% C.I. The value above the bars represents the p-value of the proportion test. (C) The plot represents the proportion test for all 132 clustered miRNAs in the genome. The upper panel shows the p-value of the proportion test, and the dotted horizontal line denotes p-value of 0.05. The lower panel shows the distribution of differential expression of miRNAs in each cluster where the dotted horizontal represents clusters with 3 or more miRNAs. (D) The bar-plot showing miRNA with large fold changes along with statistical significance in molecular subtypes of breast cancer. The downregulated genes are represented by purple color, and upregulated genes toward right are denoted by yellow color.

