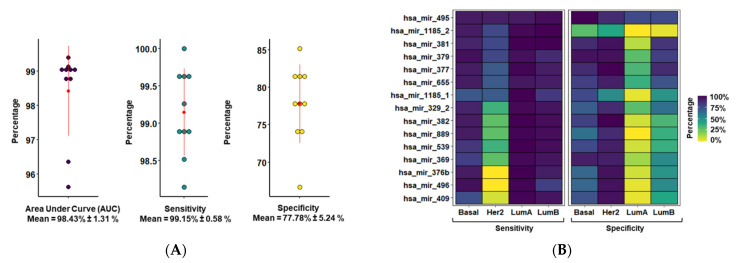
Figure 2.
Prognostic potential of MiR-379/656 in breast cancer. (A) The plot shows distribution of AUC, sensitivity and specificity of classification models built using different sets of training and test data (n = 10). The error bar shows the mean and standard deviation. (B) The tile plot showing the sensitivity and specificity measure of 15 miRNAs at MiR-379/656 as determined by univariate binomial logistic regression model across molecular subtypes of breast cancer.

