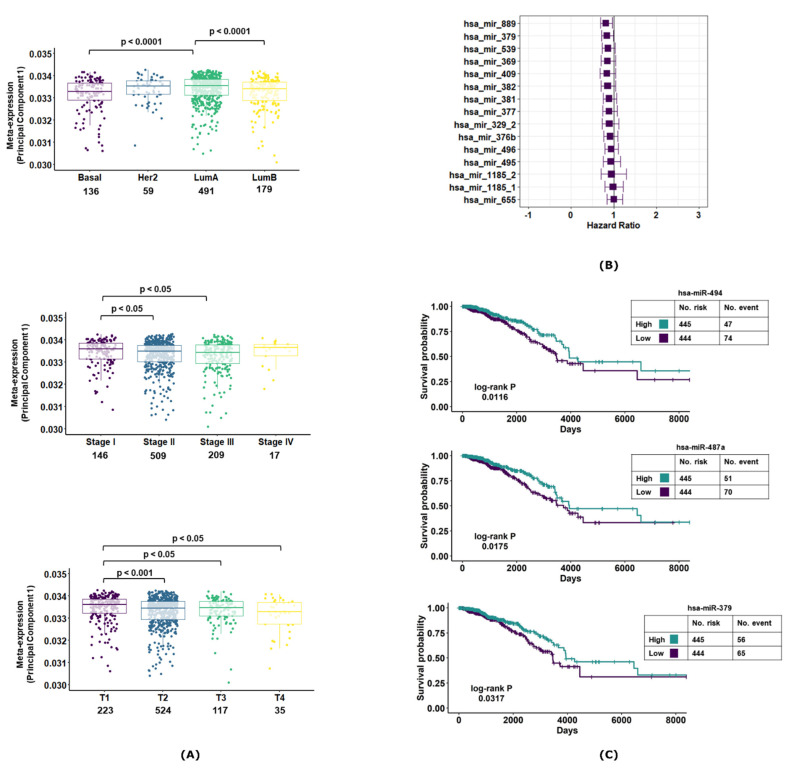
Figure 3.
Correlation of MiR-379/656 with clinical features in breast cancer. The boxplot showing the meta-expression of 15 prioritized miRNAs at MiR-379/656 defined by the first principal component across different (A) molecular subtypes, tumor stages and tumor size/extent of breast cancer. The value above the boxplot represents the p-value of Mann–Whitney U-Test of different group comparisons. (B) The forest plot represents the hazard ratio along with 95% C.I. of the subset of 15 miRNAs at MiR-379/656. (C) The Kaplan–Meier survival curves of MiR-487a, MiR-379 and MiR-494. The patients in high- and low-expression groups are determined by the median expression value cut-off. The log-rank p denotes the p-value of the test comparing the differences in the distribution of survival in the two groups.

