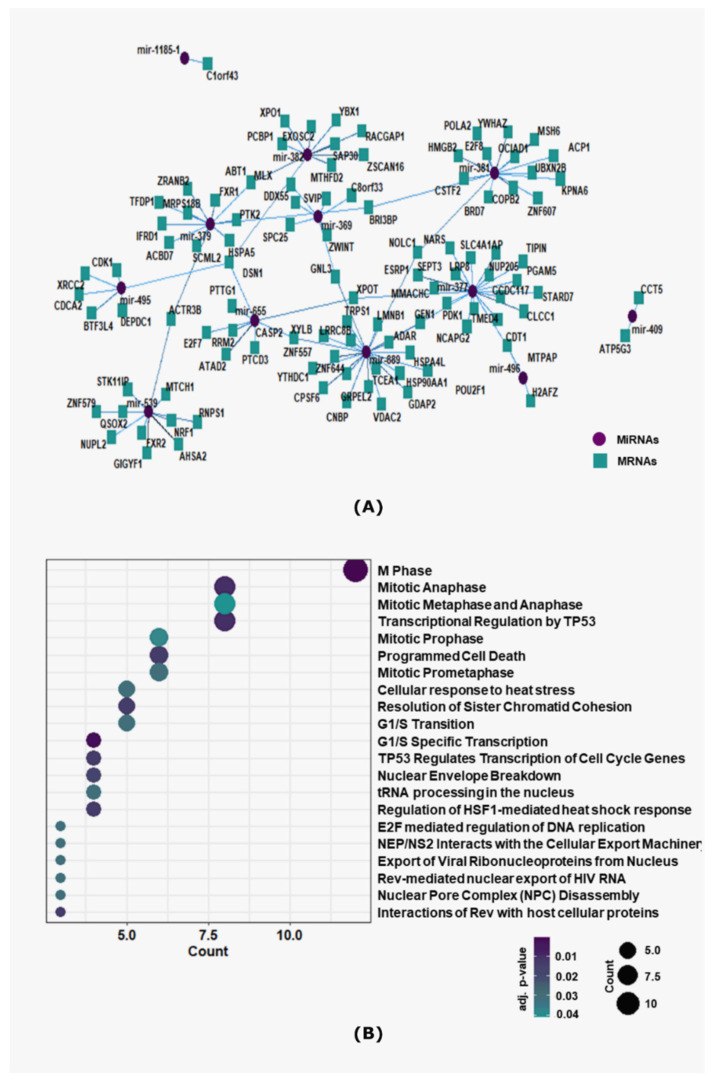
Figure 4.
Pathway enrichment of target mRNAs of MiR-379/656 in breast cancer. (A) Interaction network plot of MiR-379/656 and negatively correlated target mRNAs. The purple-circled node represents the miRNAs, and the blue-squared nodes represent the mRNAs connected via edges representing interactions. (B) The dot-plot showing the top 20 statistically significant REACTOME pathways enriched for anti-regulated target mRNAs. Each point represents a pathway, arranged according to the overlapping count of genes, and the color of the point indicates −log10 adjusted p-value.

