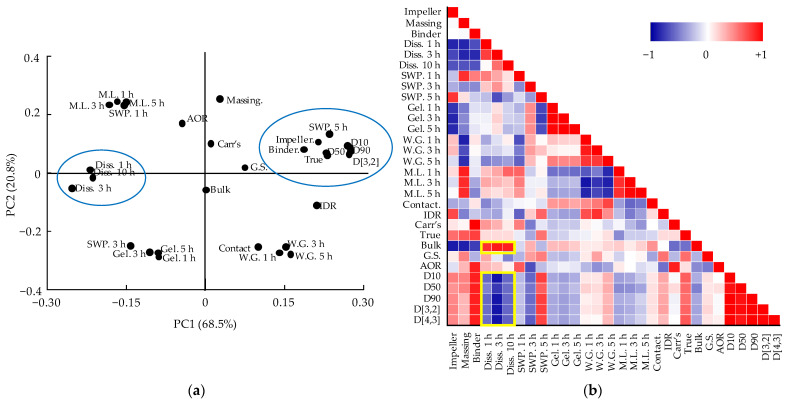
Figure 6.
Result of MVA for metformin HCl layer process development: (a) loading plot with PC1 and PC2; (b) Pearson correlation coefficient. The blue lines and yellow boxes indicate the variables having a high correlation with dissolution. Impeller, impeller speed; Massing, massing time; Binder, binder solvent amount; SWP, swelling property; W.G., weight gain; M.L., mass loss; Gel., gel strength; Diss., dissolution; Contact, contact angle; IDR, intrinsic dissolution rate; Carr’s, Carr’s index; G.S., granule strength; AOR, angle of repose; True, true density; Bulk, bulk density.

