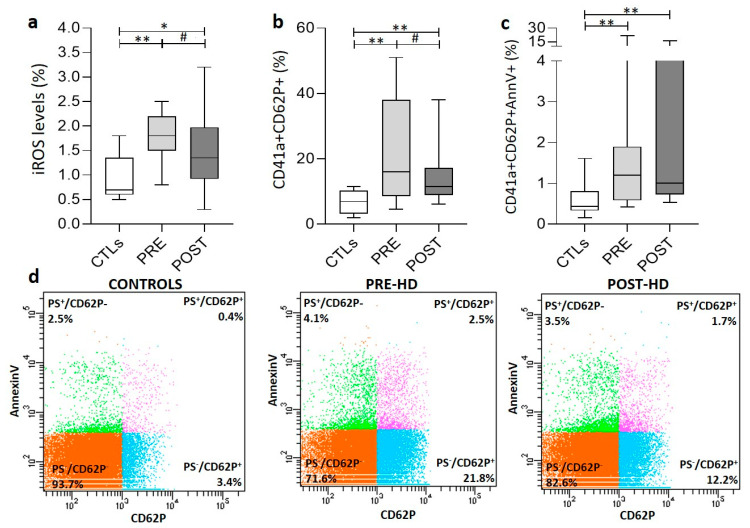
Figure 2.
Variation in platelet characteristics in ESRD patients and healthy subjects (CTLs). (a) Percentage of ROS+ platelets (iROS). (b) Percentage of CD62P+-platelets. (c) Percentage of CD62P+/AnnV+ platelets. (d) Representative FACS plots of AnnV-PE and CD62P-APC labeled platelets from ESRD patients, before and after dialysis session, and healthy subjects. PRE, POST: ESRD patients pre-HD and post-HD, respectively (*) p < 0.05 vs. controls (**) p < 0.01 vs. controls, (#) p < 0.01 pre- vs. post-HD.

