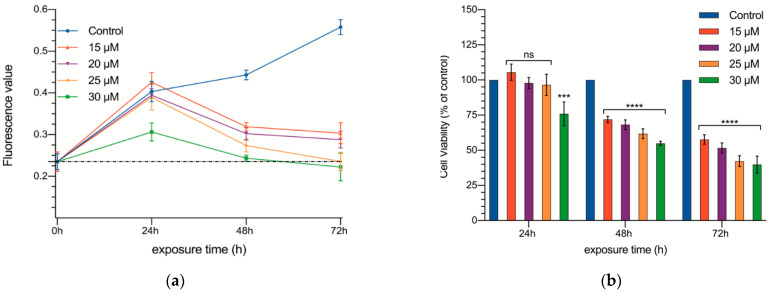
Figure 1.
Cell proliferation of CC531 rat colorectal cancer cells as a function of time. Absolute fluorescence values (a) and percentage of control (b) and cultures supplemented with 15, 20, 25, and 30 µM of curcumin at 24, 48, and 72 h. The dotted line of the figure a shows fluorescence values prior to curcumin exposure. Results are expressed as mean and standard deviation (SD) from three replicates (16 well per replicate), and have been statistically analyzed by a one-way ANOVA test, followed by Newman−Keuls multiple comparison test for between-group comparisons. Asterisks indicate statistical significance: ***: p < 0.001; **** p < 0.0001; ns: p > 0.05.

