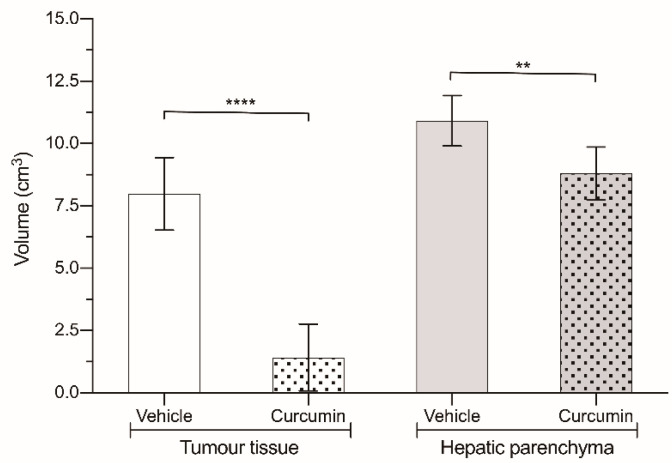
Figure 3.
Volume of liver (grey) and tumor (white) tissue in animals treated with 200 mg/kg curcumin (dotted bars) and in animals treated with vehicle (solid bars). Results are expressed as mean and standard deviation (SD) from a single replicate (10 animals per group) and statistically analyzed by two-tailed t-test. Asterisks indicate statistical significance: **: p < 0.01; **** p < 0.0001.

