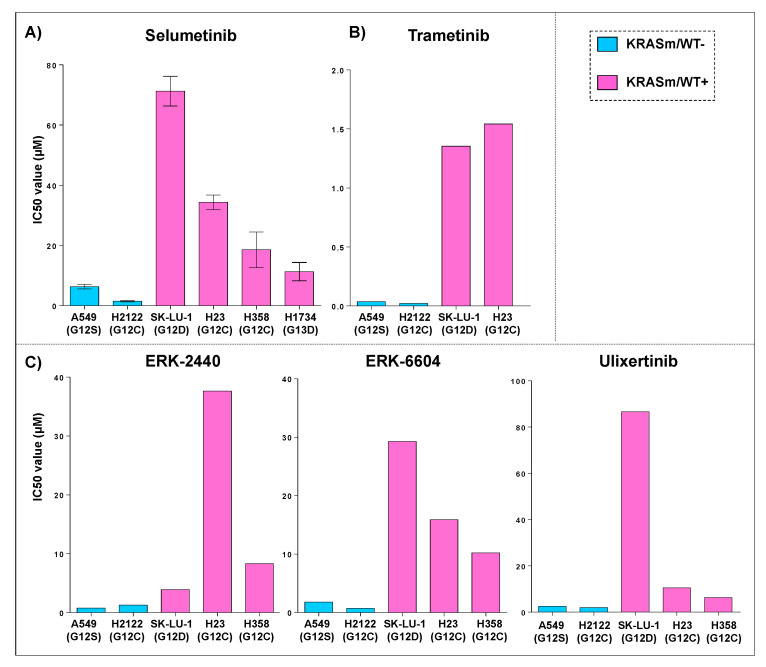
Figure 2.
Sensitivity to MEK and ERK inhibitors in KRASm/WT− and KRASm/WT+ adenocarcinoma cell lines. IC50 values for KRAS mutant cell lines treated with a kinase inhibitor targeting KRAS downstream substrates are displayed as bar graphs where cell lines are color-coded based on the presence (KRASm/WT+ pink) or absence (KRASm/WT− blue) of the KRAS WT allele. IC50 average values (n = 4) and standard error of the mean after incubation with the MEK inhibitor Selumetinib for 72 h are displayed (A); models harboring KRASm/WT− mutations are more sensitive to MEK inhibition compared to cell lines retaining the wild-type copy of the KRAS allele (A). These trends were confirmed using data retrieved from the Genomics of Drug Sensitivity in Cancer (GDSC) database for the MEK inhibitor Trametinib (B) and the ERK inhibitors Ulixertinib, ERK6604 and ERK2440 (C). Single IC50 values are available for each compound on the GDSC database.

