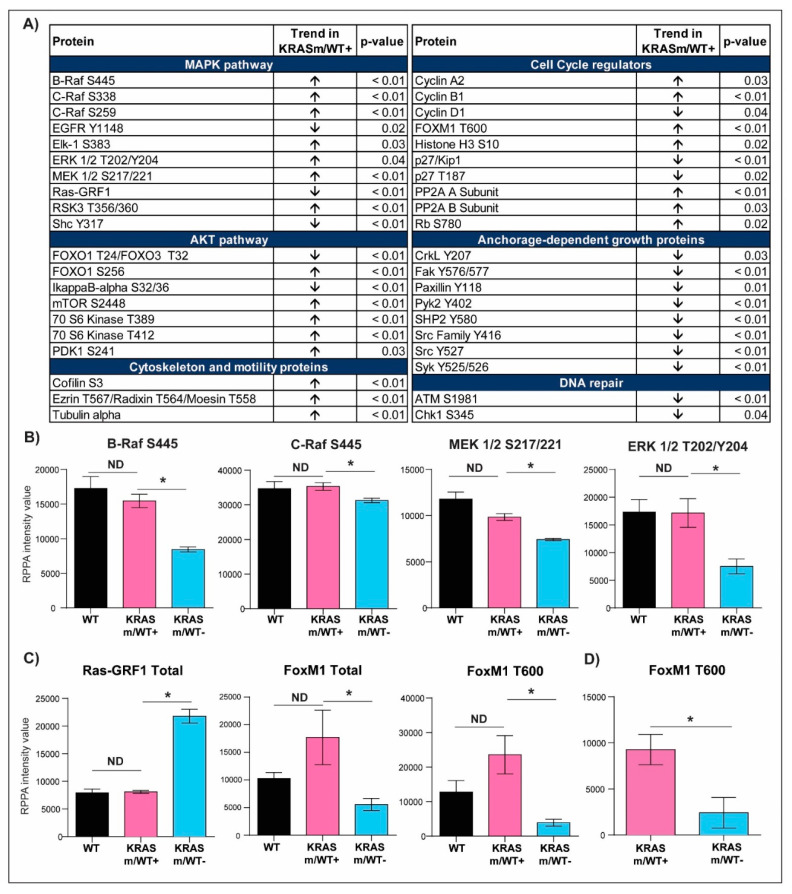
Figure 4.
Selected signal transduction molecules differentially activated in KRASm/WT+ and KRASm/WT− NSCLC models. Of the 183 signaling molecules measured by RPPA, 81 reached statistical significance when KRASm/WT− and KRASm/WT+ cell lines were compared. Proteins belonging to the same signaling pathway were grouped based on their biological function and are displayed in (A). Arrows reflect trends in the KRASm/WT+ cells (H1734, H23, H358) compared to KRASm/WT− (A549, H2122) models. Bar graphs displaying mean and standard error of the mean for member of the MAPK pathway are shown in (B). Of interest, while the activation of KRAS downstream signaling substrates reached statistical significance when KRASm/WT− and KRASm/WT+ cell lines were compared (*), these differences were lost between KRASm/WT+ and KRAS wild-type models (ND). Similar trends were also detected for Ras-GRF1, a modulator of RAS activity, and the cell cycle regulator FoxM1 (C). Differences in the activation of the cell cycle regulator FoxM1 between KRASm/WT− and KRASm/WT+ tumors were confirmed in surgical specimens, suggesting clinical relevance for this finding (D). * Indicates comparisons that were statistically different (p < 0.05).

