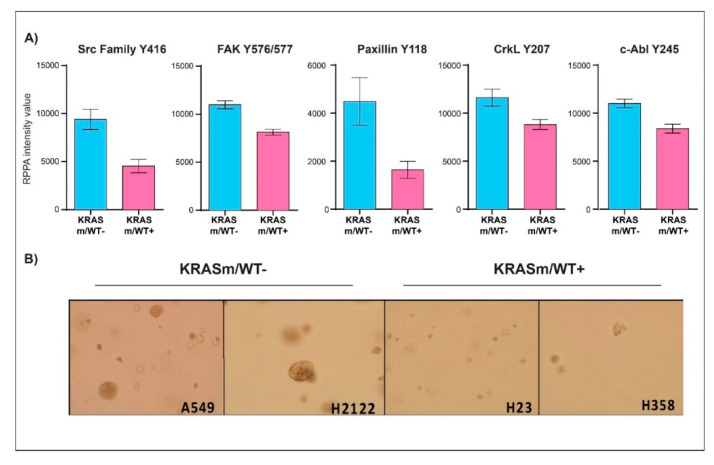
Figure 5.
Anchorage-independent growth is enhanced in KRASm/WT− NSCLC cell lines. Bar graphs display mean and standard error of the mean of expression and activation of key signaling molecules involved in anchorage-independent growth in KRASm/WT− (A549, H2122) and KRASm/WT+ (H1734, H23, H358) (A). Colony formation assay shows larger and more abundant colonies in the KRASm/WT− cell lines compared to KRASm/WT+ models (B), confirming increased anchorage-independent growth in the KRASm/WT lines.

