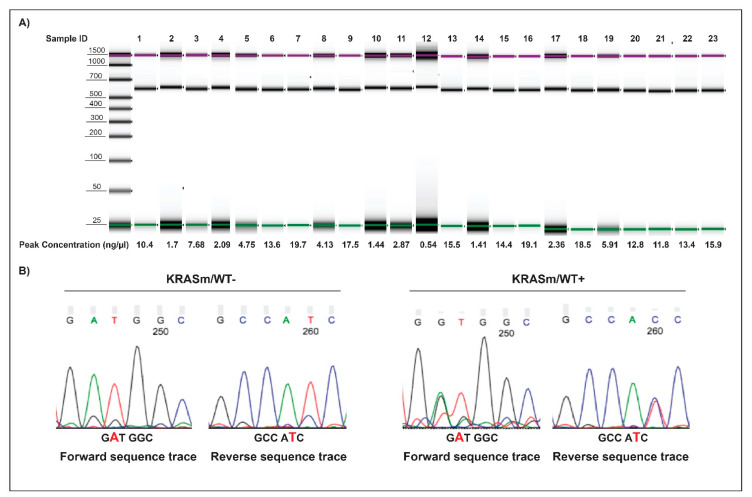
Figure 7.
Amplicons and electropherogram of 23 microdissected NSCLC surgical specimens. Amplicons along with DNA concentration of the 23 microdissected biospecimens analyzed by PCR are displayed in (A). Examples of sequencing electropherograms with forward and reverse sequence of KRASm/WT+ and KRASm/WT− samples harboring a KRAS G12D mutation are shown in (B). Samples were classified as KRASm/WT− when a single peak was detected at the mutation site.

