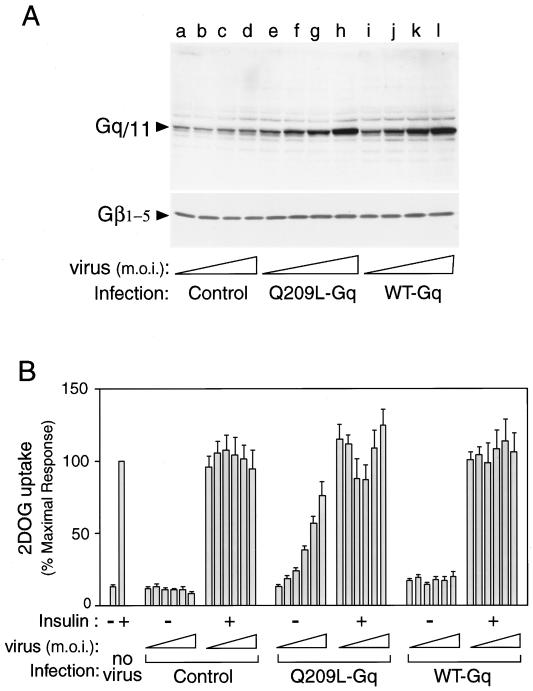
FIG. 2.
Expression and effects of Gαq on glucose uptake into the 3T3-L1 adipocytes. (A) Differentiated 3T3-L1 adipocytes were infected with various concentrations (MOI = 1, 5, 10, and 20) of adenovirus expressing WT Gαq, Q209L-Gαq, or mock-infected control. After 60 h of infection, these cells were lysed, and total-cell lysates were analyzed by Western blotting with anti-Gαq/11 C-terminal antibody (top) or anti-Gβ1–5 antibody (bottom), as described in Materials and Methods. These experiments were repeated twice. (B) 3T3-L1 adipocytes were infected with various concentrations (MOI = 1, 5, 10, 20, 30, and 40) of adenovirus expressing WT Gαq, Q209L-Gαq, or mock control. After 60 h of infection, these cells were stimulated with 100 ng of insulin per ml for 1 h and 2-[3H]deoxyglucose uptake was measured as described in Materials and Methods. The data are the means and standard errors from four independent experiments.

