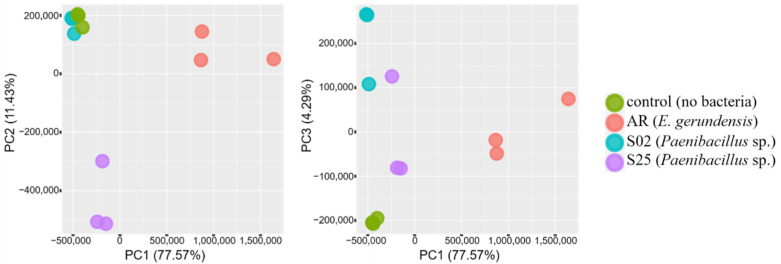
Figure 3.
Principal component analysis (PCA) plots representing the clustering of biological replicates based on gene expression levels of barley seedling roots when using Nutrient Broth. Percentage variance explained by each axis is given in brackets. Seedlings co-incubated with strain AR (E. gerundensis) or S25 (Paenibacillus sp.) are separated from the control seedlings along all three axes (PC1–PC3). However, seedlings co-incubated with strain S02 (Paenibacillus sp.) are separated from the control seedlings only along the PC3 axis, which accounts for 4.29% of the total variances, suggesting strains AR and S25 triggered more obvious changes in transcriptome profiles of barley seedlings when compared with strain S02.

