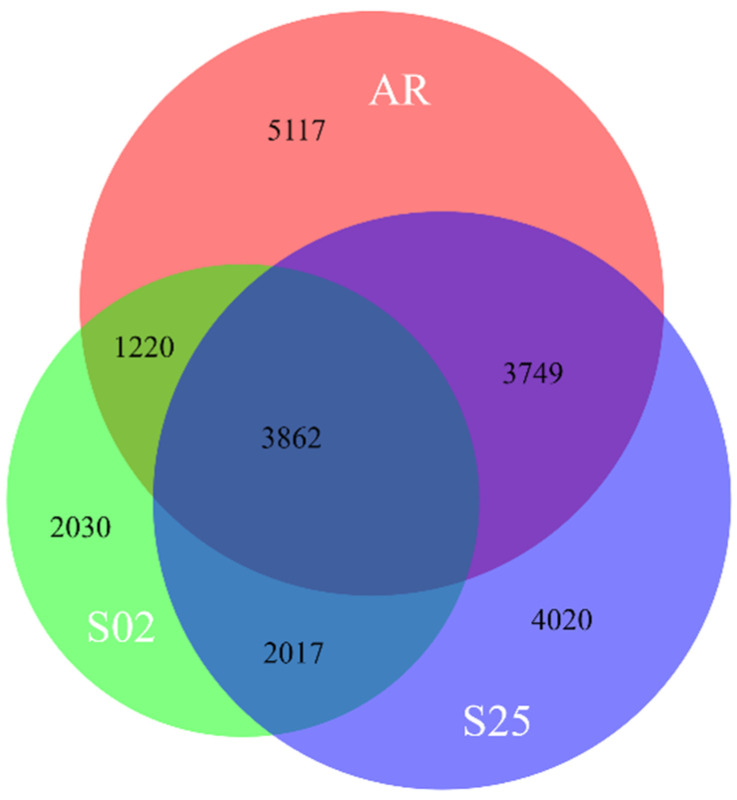
Figure 5.
A Venn diagram that shows the number of barley genes that were differentially expressed in roots during the plant–bacteria interaction assay for all three strains in Nutrient Broth. A total of 22,015 genes were differentially expressed. AR: Novel E. gerundensis strain; S02/S25: Novel Paenibacillus sp. strains.

