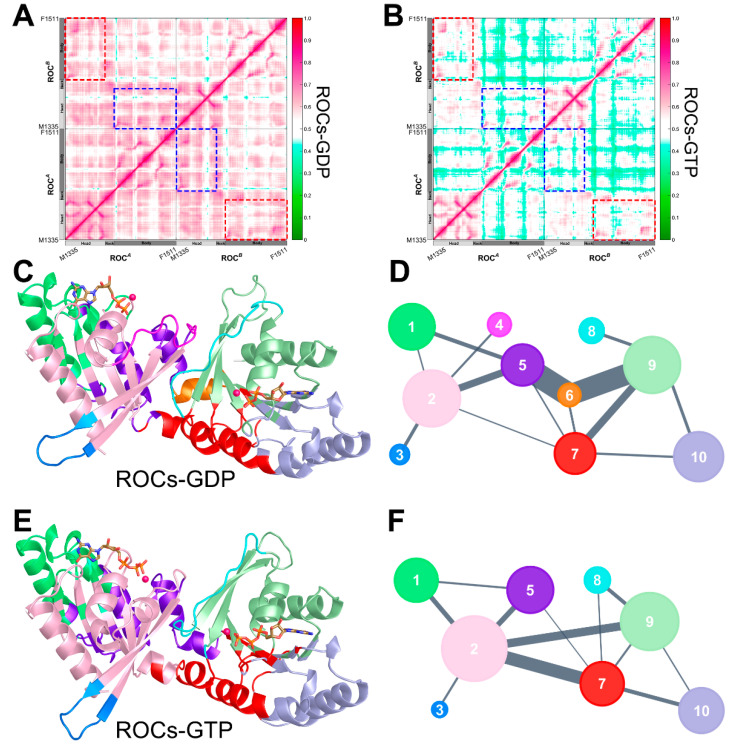
Figure 4.
Generalized cross correlation matrix (GCCM) of (A) ROCs-GDP and (B) ROCs-GTP. The colormap used for the graph is shown on the right with no/weak correlations indicated in green and strong ones in magenta. The correlation between ROCA head and ROCB body, and that between ROCA body and ROCB head subdomain, is highlighted in red and blue dashed line rectangles, respectively. Cartoon representation of (C) ROCs-GDP and (E) ROCs-GTP color-coded based on their corresponding community structures. Simplified community network map with inter-community crosstalk in (D) ROCs-GDP and (F) ROCs-GTP. Each community in the original structure is reduced to a sphere whose area is proportional to the residue components. Inter-community crosstalk is visualized by sticks of width that are proportional to edge connectivity between communities.

