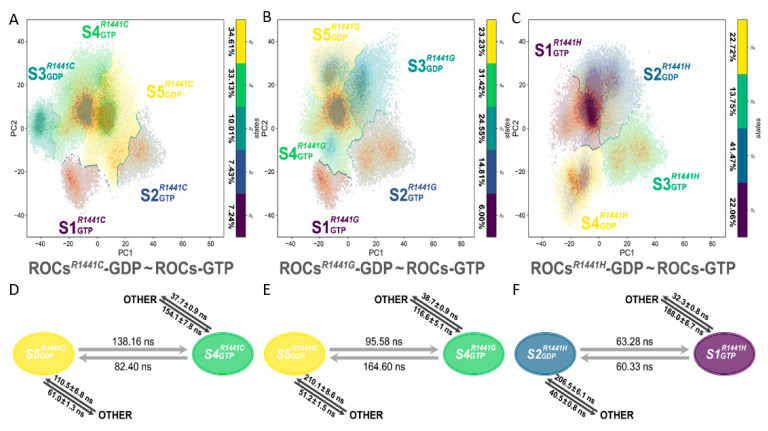
Figure 5.
Distribution of metastable states in (A) ROCsR1441C-GDP~ROCs-GTP (5 macrostates), (B) ROCsR1441G-GDP~ROCs-GTP (5 macrostates), and (C) ROCsR1441H-GDP~ROCs-GTP (4 macrostates) MSM. The type of nucleotide ligand for ROCs is indicated with subscripts, and the percentage of each macrostate is shown beside the corresponding colormap. MFPT between the predominant GDP-bound ROCs mutant and GTP-bound ROCs calculated in (D) ROCsR1441C-GDP~ROCs-GTP, (E) ROCsR1441G-GDP~ROCs-GTP, and (F) ROCsR1441H-GDP~ROCs-GTP MSM. The two-ended black arrow between metastables and OTHER denoted the transition between the implicated macrostates and all other remaining metastable states in the corresponding MSM.

