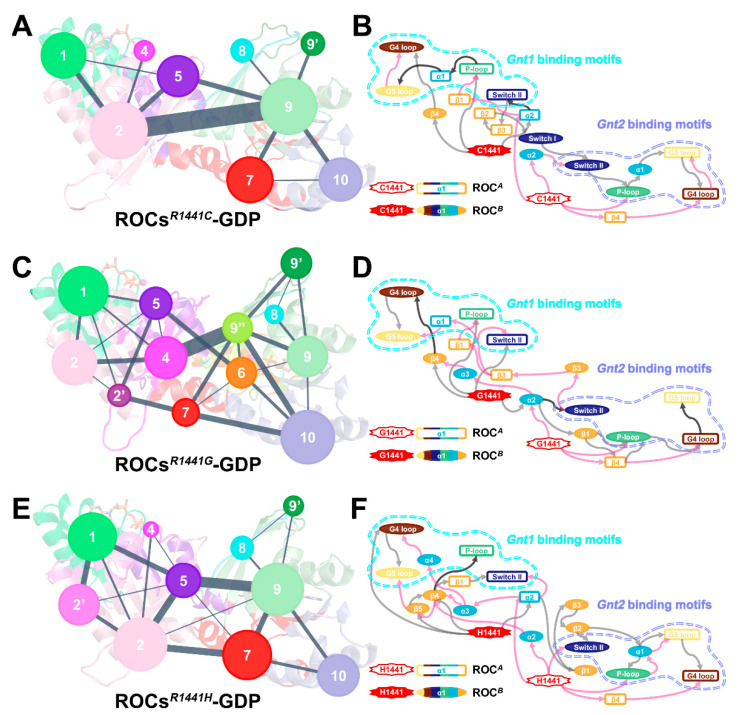
Figure 6.
Simplified community network map with inter-community crosstalk in (A) ROCsR1441C-GDP, (C) ROCsR144G-GDP, and (E) ROCsR144H-GDP. Cartoon diagrams with residues color-coded by their corresponding community partition were made transparent as the background to indicate the spatial position of each community. A schematic diagram of allosteric signaling between the mutated site at position 1441 and the nucleotide-binding motifs Gnt1 and Gnt2 (marked with cyan and orchid dotted lines) in (B) ROCsR1441C-GDP, (D) ROCsR144G-GDP, and (F) ROCsR144H-GDP mutants. Secondary structures of ROCA are represented by colored hollow rectangles, and ROCB components are shown in filled ovals. The gray and pink arrows, respectively, indicate allosteric signals from the mutation site on ROCA and ROCB, and black arrows denote paths involved in transmitting signals from both mutation sites. Note that all arrows here are one-ended for clarity; the actual information flow can pass in both directions for reversible communication.

